Description
Why Rook Footprint?
Whether you're confirming breakouts, identifying potential reversals, monitoring market participation, or analyzing liquidity, Rook Footprint provides professional order flow tools in a fast, clean, and intuitive package.
Designed for traders who want deeper market insight without unnecessary complexity.
Features
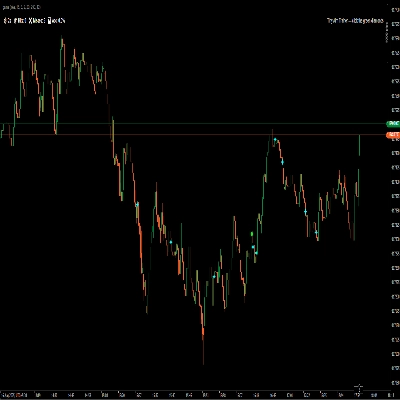
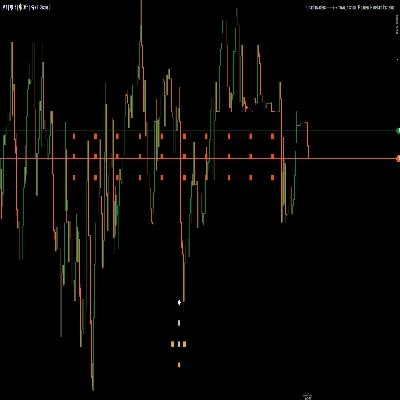
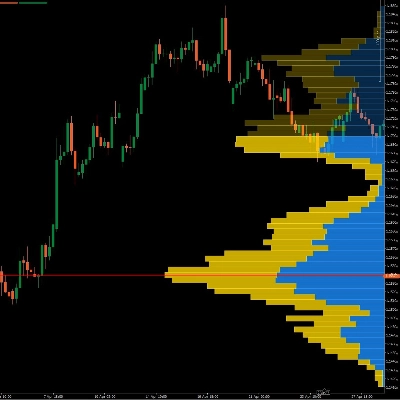
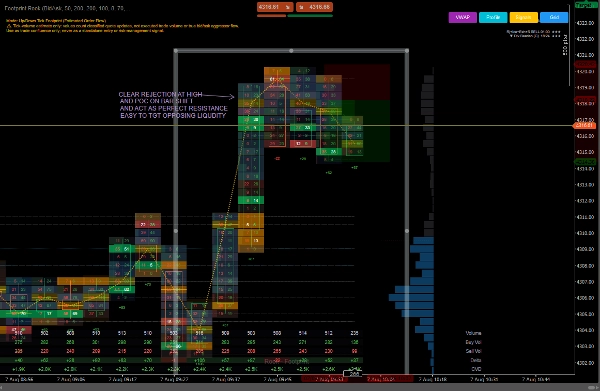
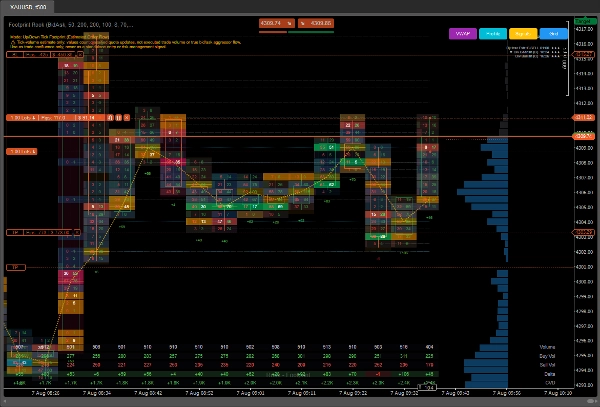
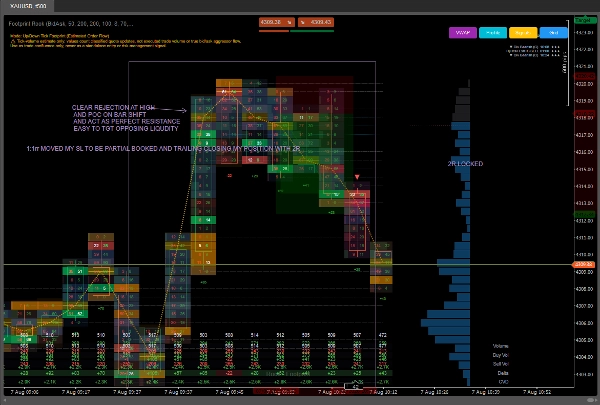
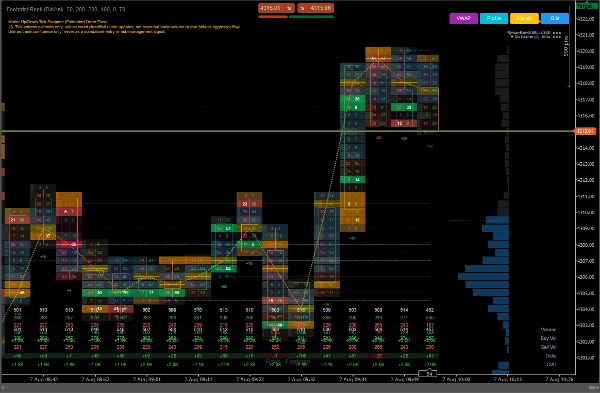
Visualize buying and selling activity at every traded price level with a clean footprint display and intelligent heatmap visualization.
- Automatically detects available broker data.
- Uses Bid Ask when supported.
- Automatically falls back to Up Down Tick mode when Bid/Ask data is unavailable.
Order Flow Analysis
- Imbalance Detection
- Stacked Imbalance Zones
- Absorption Detection
- Exhaustion Detection
- Delta Analysis
Designed to help identify important areas of buying and selling activity with clear visual presentation.
Statistics Panel
Monitor essential market statistics for every footprint bar, including:
- Total Volume
- Buy Volume
- Sell Volume
- Delta
- Cumulative Delta (CVD)
All statistics are presented in a clean, easy-to-read layout directly beneath the chart.
Designed for Clarity & Performance Focused
Rook Footprint emphasizes readability without unnecessary clutter.
- Professional heatmap visualization
- Easy-to-read statistics
- Customizable colors and appearance
Everything is designed to help you interpret order flow quickly while keeping your charts clean and focused.
Works with:
- Forex
- Futures
- Indices
- Commodities
- Crypto
Supports all chart timeframes and automatically adapts to the market data available from your broker.
For the best experience:
- Use brokers that provide high-quality tick data.
- Increase "Ticks" on highly volatile instruments if you prefer a cleaner display.
- Reduce the number of "visible bars to Display" on lower-powered computers.
- Combine footprint analysis with your existing trading strategy rather than using it as a standalone signal.
Requirements
- C trader Desktop (Windows or macOS)
- No external data feeds required
- Uses C Trader's built-in market data
- Access Rights: None
Category: Volume / Order Flow
Tags: footprint, order flow, bid ask, up/down tick, delta, cumulative delta, volume analysis, imbalance, absorption, exhaustion, liquidity, support resistance,
Important data notice Rook - Footprint uses classified broker Bid/Ask quote updates to estimate Up/Down Tick pressure. It does not provide verified executed trade volume, true bid-at/ask-at aggressor volume, or centralized FX market volume. Use all footprint readings and signals as trade confluence only, never as a standalone entry, exit, or risk-management system.
Disclaimer :
Trading financial markets involves substantial risk, and past performance does not guarantee future results.
Order flow information is derived from the market data made available by your broker through C Trader. When true Bid/Ask data is available, the indicator automatically uses it for footprint calculations. Otherwise, it uses Up/Down Tick estimation. Data quality and available features may vary between brokers and instruments. This indicator is an analytical tool and does not provide financial, investment, or trading advice.
Summary
Key order flow analysis features include imbalance detection, stacked imbalance zones, absorption and exhaustion detection, and delta analysis. A statistics panel beneath the chart presents total volume, buy and sell volume, delta, and cumulative delta (CVD) in an easy-to-read format.
Rook Footprint supports all chart timeframes and adapts automatically to the market data provided by the broker. It is compatible with multiple markets including Forex, Futures, Indices, Commodities, and Crypto. The indicator emphasizes clarity and performance with customizable colors and a clutter-free layout to facilitate quick interpretation of order flow.
No external data feeds or special access rights are required, as it uses cTrader’s built-in market data. It is intended as an analytical tool to complement existing trading strategies.