

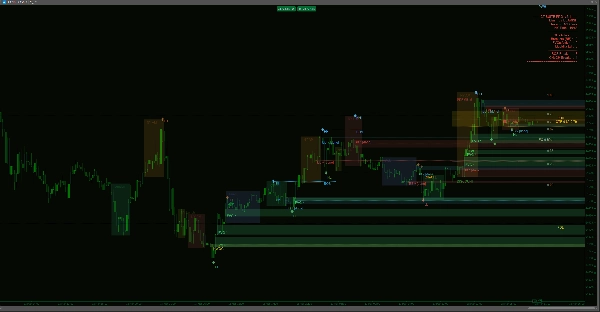
Description
SMC Smart Money Suite Pro — Complete Institutional Price Action Toolkit for cTrader
If you trade using smart money concepts or any price action methodology rooted in institutional order flow, you know the pain: a dozen indicators scattered across your chart, each one partially doing the job, none of them talking to each other. Smart Money Suite Pro was built to solve that entirely.
This is a single, self-contained indicator that covers every major concept within the institutional price action and smart money methodology — engineered from the ground up for cTrader, optimised to run cleanly on live charts without flickering, and packed with quality-of-life features that make it genuinely usable in real trading sessions.
Market Structure — Automatic and Precise
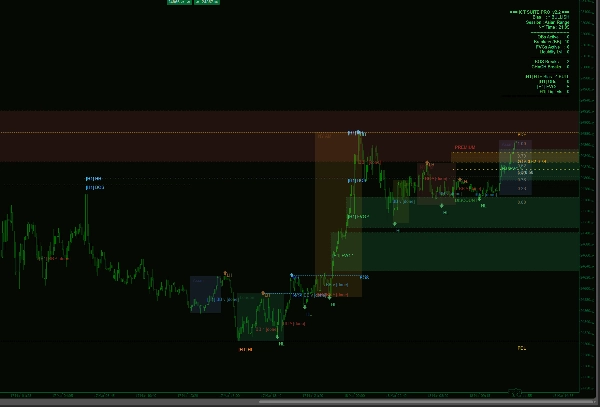
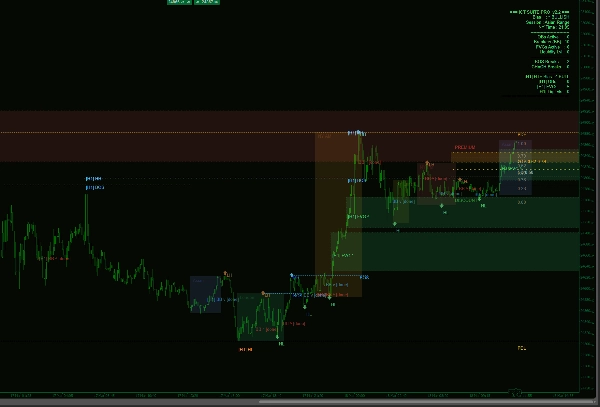
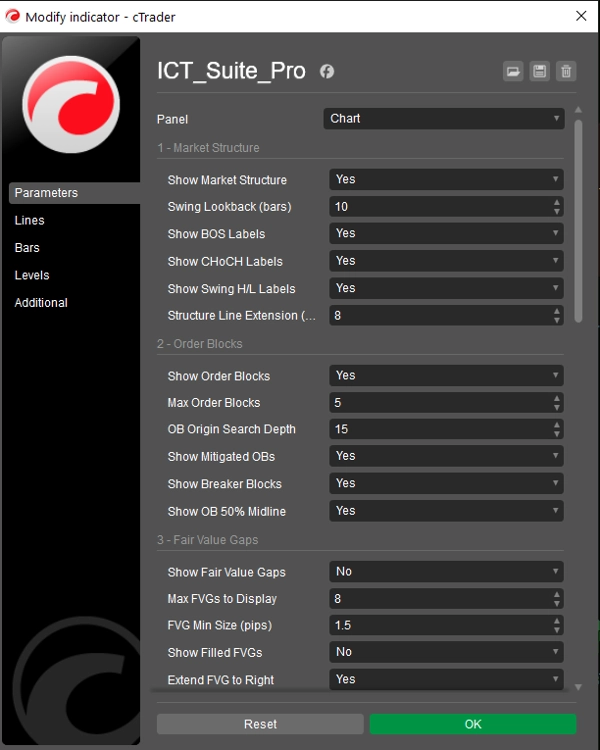
The indicator continuously scans your chart for confirmed swing highs and lows, classifying each as Higher High, Lower High, Higher Low, or Lower Low. Every Break of Structure (BOS) and Change of Character (CHoCH) is detected and labelled with a dotted level line so you can see exactly where price broke the prior structure. The distinction between BOS (trend continuation) and CHoCH (trend reversal) is colour-coded so it reads instantly at a glance. Swing lookback depth is fully adjustable.
Order Blocks — With Full Lifecycle Tracking
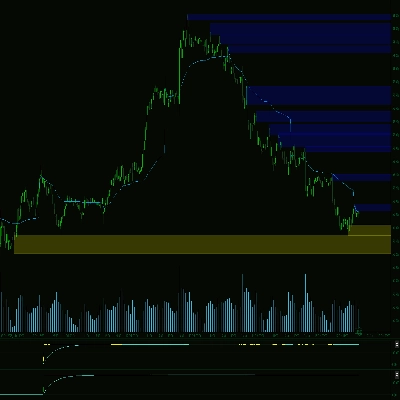
Order blocks are identified by locating the last opposing candle before each impulse move that led to a confirmed swing. Each block is drawn as a coloured box extending to the right of the chart so you can see at a glance whether price has returned to the zone. When an order block is mitigated, the rectangle is removed and replaced by a faint text marker — keeping your chart clean while preserving a record of the level. When price subsequently violates through the other side of a mitigated order block, it is reclassified as a Breaker Block and recoloured, signalling a potential reversal zone. A 50% midline is drawn inside each active block to highlight the premium/discount divide within the zone itself.
Fair Value Gaps — Tracked Until Filled
Three-candle price imbalances are detected in both directions across your entire lookback window. Each gap is filtered by a configurable minimum pip size to eliminate noise. Unfilled gaps extend to the right of the chart until price returns to close them, at which point they are either removed or marked as filled depending on your settings. Both bullish and bearish imbalances are handled simultaneously.
Liquidity Levels — Equal Highs and Equal Lows
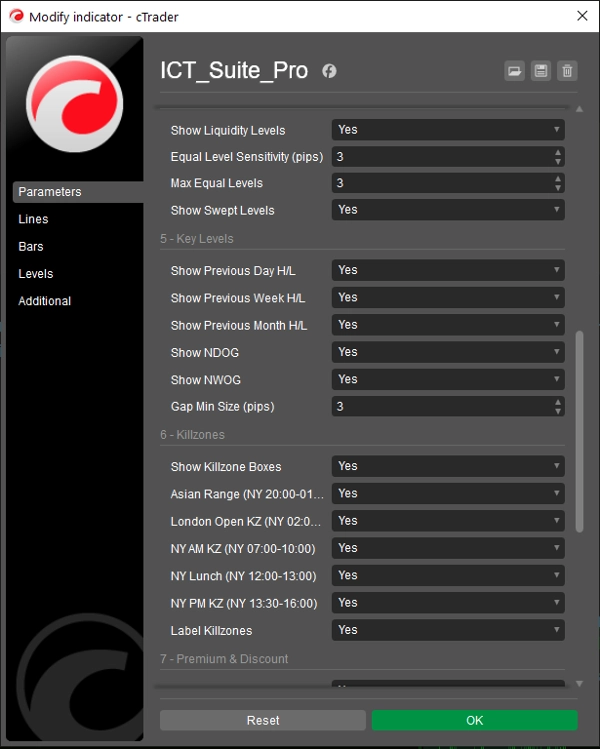
The indicator scans for clusters of swing highs or swing lows that sit within a configurable pip tolerance of each other — identifying the buy-side and sell-side liquidity pools that institutional order flow tends to target. Each level is drawn with tick marks at both swing points and a dotted line projecting to the right. Once price sweeps through a liquidity level it is either hidden or marked as swept depending on your preference.
Key Levels — Previous Day, Week, and Month
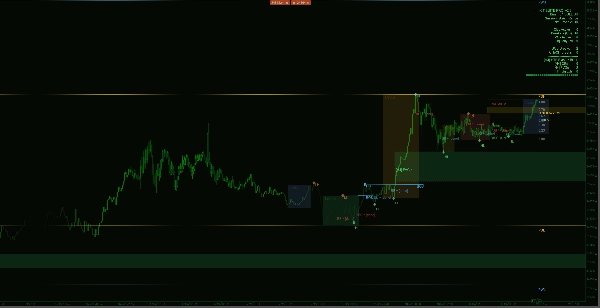
Previous Day High/Low, Previous Week High/Low, and Previous Month High/Low are automatically calculated from your chart's own price data. All date boundaries are derived from the broker's bar timestamps — not your local system clock — so they remain accurate regardless of your time zone or instrument rollover. Each level pair uses a distinct colour and line style so they layer cleanly on the chart.
Opening Gaps — Daily and Weekly
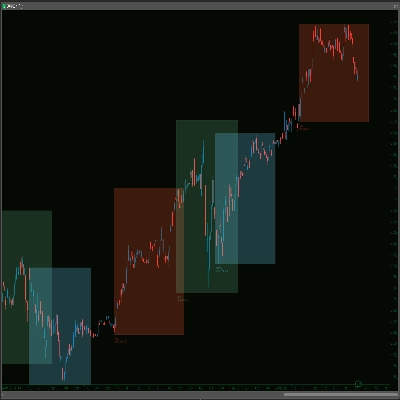
The indicator scans every daily and weekly open for a price gap between the prior session's close and the current session's open. Any gap exceeding your defined minimum pip size is drawn as a coloured rectangle. New Day Opening Gaps and New Week Opening Gaps are distinguished by different colours, giving you an instant read on which gaps remain unfilled.
Session Killzones — With Real Range Boxes
Asian, London Open, New York AM, New York Lunch, and New York PM session windows are drawn as filled boxes spanning the actual high-to-low range formed during each period. Times are based on New York time and automatically adjust for EDT/EST daylight saving. Each box can be individually toggled and labelled. Because the boxes reflect actual price range rather than fixed vertical lines, you can immediately see how active each session was and where price found its extremes.
Premium & Discount Zones — With Optimal Entry Range
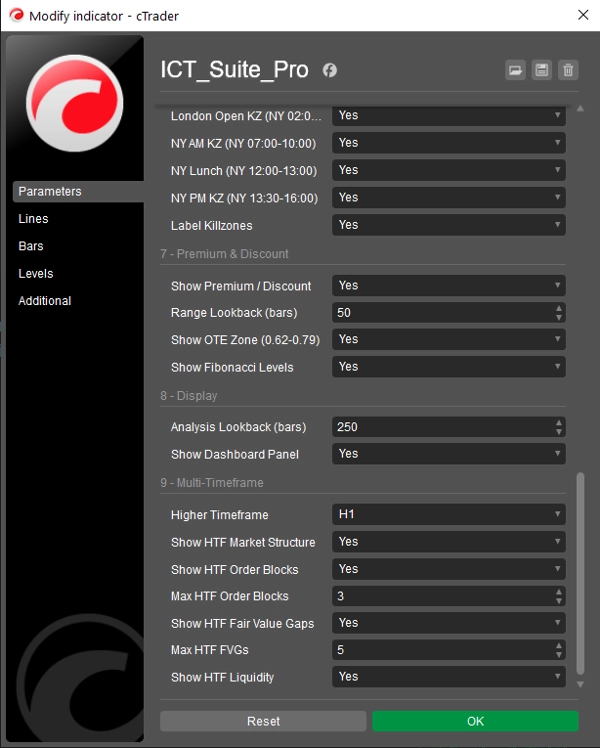
A rolling range analysis calculates the highest high and lowest low over a configurable lookback. From this range, the indicator draws the Equilibrium (0.50), an optimal entry zone (0.62–0.79 Fibonacci), and the full set of key Fibonacci retracement levels. Premium and Discount labels are placed inside the range so you always know which half of the current dealing range price is trading in. The lookback is automatically clamped to match your visible bar window so no levels ever reference bars you cannot see.
Multi-Timeframe Overlay — The Standout Feature
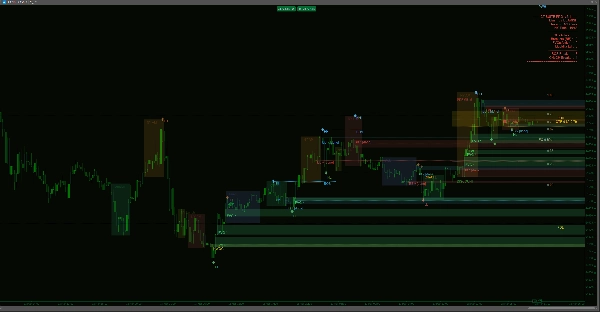
The MTF system reconstructs higher-timeframe candles by aggregating the current chart's bars into time-aligned slots — no separate data subscription required. Select your higher timeframe from the dropdown (M5, M15, M30, H1, H4, D1) and Smart Money Suite Pro will calculate and draw higher-timeframe Order Blocks, Fair Value Gaps, Market Structure, and Liquidity Levels directly over your current chart. Higher-timeframe items are visually distinct: thicker borders, dashed outlines, and labels prefixed with the timeframe tag (e.g. [H4] OB ^) so you always know which timeframe a level belongs to.
If you select a higher timeframe that is at or below your current chart timeframe — an impossible configuration — the indicator displays a clear warning on screen and draws nothing, preventing any misleading data from appearing.
The dashboard panel updates with a dedicated higher-timeframe section when the overlay is active, showing HTF bias, active order block count, fair value gap count, and liquidity level count alongside the current-timeframe summary.
Live Dashboard
A clean, right-anchored panel displays: current market bias, active trading session, New York time, counts of all active order blocks, breaker blocks, fair value gaps, and liquidity levels, plus the total number of BOS and CHoCH breaks detected in the lookback window. When the multi-timeframe overlay is enabled, the higher-timeframe summary is appended automatically below.
Built for Live Trading
The indicator redraws only when a new bar forms — not on every incoming tick — eliminating the chart flicker that affects many all-in-one indicators. All analysis runs within a configurable lookback window so performance stays consistent even on lower timeframes with large bar counts.
Summary
SMC-Pro features premium and discount zones derived from Fibonacci retracement levels within a rolling price range, aiding optimal entry identification. A standout multi-timeframe overlay reconstructs higher timeframe candles and displays their corresponding order blocks, fair value gaps, market structure, and liquidity levels directly on the current chart, with clear visual distinctions and a dashboard summary of both current and higher timeframe data.
The indicator is optimized for live trading with efficient redraws only on new bars to prevent flicker and maintains performance via a configurable lookback window. It supports various markets including Forex, indices, and cryptocurrencies such as BTCUSD and XAUUSD.
Discussion
Customer reviews
5 | 33 % | |
4 | 33 % | |
3 | 0 % | |
2 | 0 % | |
1 | 33 % |











!["[Hamster-Coder] Moving Average MTF" logo](https://cdn.ctrader.com/image/webp/b11b98b1-194d-4b8e-b00e-d611826ad159_31226)













