
Description
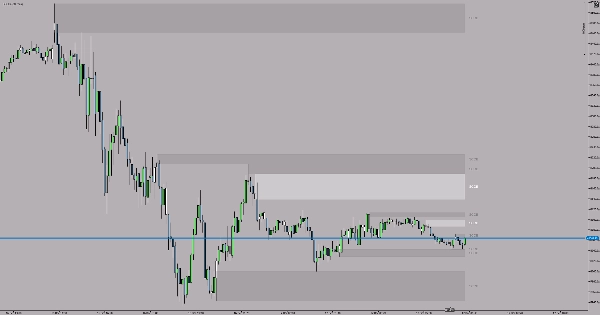
The SCOB (Single Candle Order Block) indicator automatically identifies and highlights powerful order block patterns on your chart. This simple yet effective tool helps traders spot key reversal patterns that often indicate strong institutional activity.
What is a SCOB?
A SCOB is a three-candle pattern that reveals potential reversal zones:
Bullish SCOB:
- 2nd candle makes a lower low than the 3rd candle
- 1st candle's low stays above the 2nd candle's low
- 1st candle closes above the 2nd candle's high
- The 2nd candle is highlighted as a potential support zone
Bearish SCOB:
- 2nd candle makes a higher high than the 3rd candle
- 1st candle's high stays below the 2nd candle's high
- 1st candle closes below the 2nd candle's low
- The 2nd candle is highlighted as a potential resistance zone
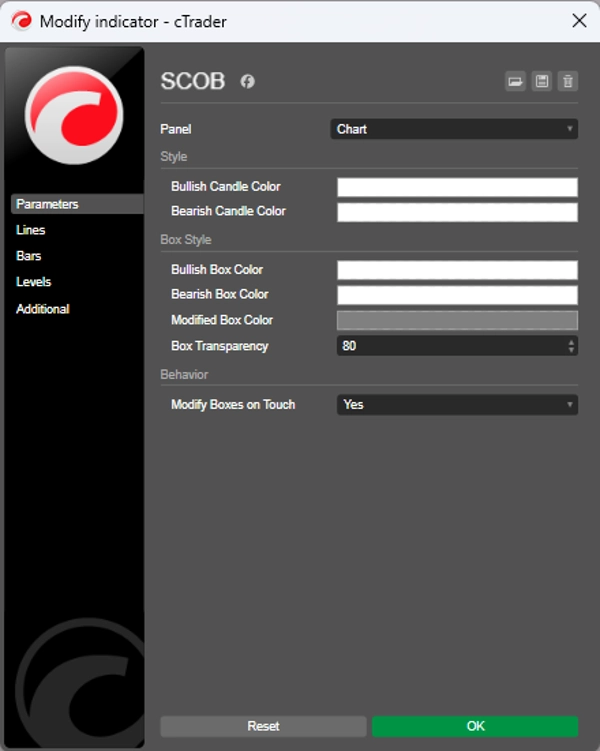
Settings
Bullish Candle Color - Choose the highlight color for bullish SCOB patterns (Default: White)
Bearish Candle Color - Choose the highlight color for bearish SCOB patterns (Default: Yellow)
Usage Tips
- Use SCOB patterns to identify potential entry zones
- Combine with other technical analysis tools for confirmation
- The highlighted candle represents a key institutional level
- Always trade with the trend for higher probability setups
- Can be used on any timeframe based on your trading strategy
- Best practice: Mark SCOB patterns on higher timeframes (H1, H4, Daily) and trade in the direction of the trend.
Summary
Indicator profile
Customer reviews
4.5
Reviews: 2
5 | 50 % | |
4 | 50 % | |
3 | 0 % | |
2 | 0 % | |
1 | 0 % |
Customer reviews
October 3, 2025
Helps more when the trader avoids forced trades. It should not replace the chart.
Discussion
FAQ
BTCUSD
Forex
Indices
EURUSD
Commodities
GBPUSD
Prop
Scalping
SMC
Crypto
Stocks
XAUUSD
NAS100
USDJPY
Products available through cTrader Store, including trading bots, indicators and plugins, are provided by third-party developers and made available for informational and technical access purposes only. cTrader Store is not a broker and does not provide investment advice, personal recommendations or any guarantee of future performance.


Price
Since 05/01/2025
14
Sales