
Supertrend - Multi-Timeframe
Indicator
1 purchases
Version 1.0, Oct 2025
Windows, Mac
4.5
Reviews: 2
Description
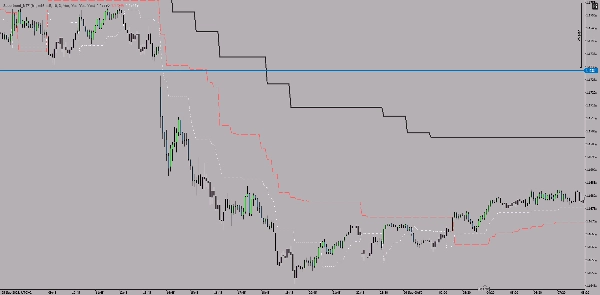
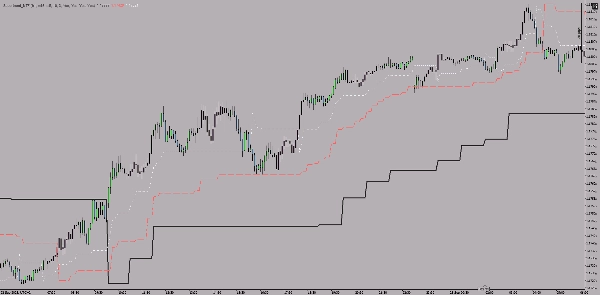
This is a Multi-TimeFrame Supertrend indicator for the cTrader platform that displays Supertrend lines from three different timeframes simultaneously on a single chart.
Key Features
Three Parallel Timeframe Display:
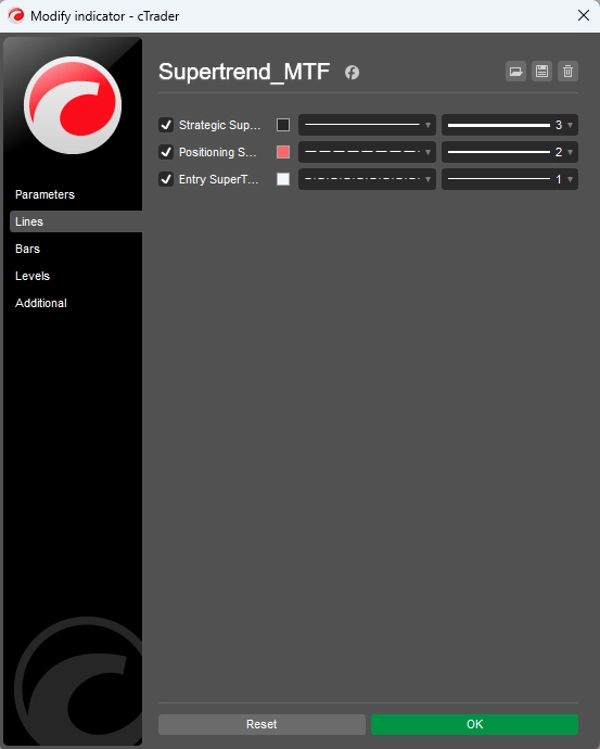
- Strategic timeframe (default: 1 hour) - thick, solid line
- Positioning timeframe (default: 15 minutes) - medium thickness, dashed line
- Entry timeframe (default: 5 minutes) - thin, dotted line
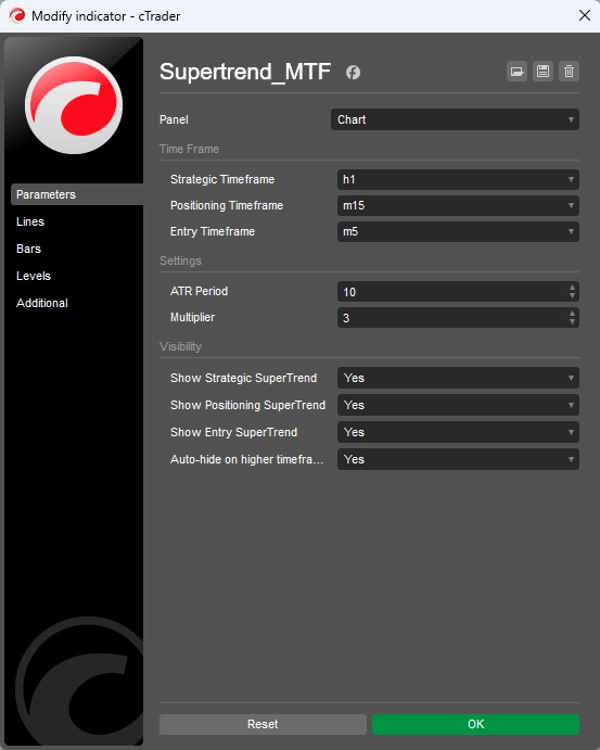
Customizable Settings:
- ATR period (default: 10)
- Multiplier (default: 3.0)
- Each of the three timeframes can be individually enabled/disabled
- Auto-hide on higher timeframes (optional)
How It Works
The indicator uses classic Supertrend logic for all three timeframes, where:
- The trend is up when price is above the Supertrend line
- The trend is down when price is below the Supertrend line
- Different line thicknesses and styles help distinguish between timeframes
Purpose
Assists in multi-timeframe analysis: the larger timeframe provides the main direction (strategy), the middle one refines positioning, and the smallest marks specific entry points.
Summary
AI summary
The Supertrend - Multi-Timeframe Indicator for the cTrader platform displays Supertrend lines from three distinct timeframes simultaneously on a single chart. It features a strategic timeframe (default 1 hour) shown as a thick solid line, a positioning timeframe (default 15 minutes) as a medium dashed line, and an entry timeframe (default 5 minutes) as a thin dotted line. Each timeframe can be individually enabled or disabled, with customizable settings including ATR period and multiplier. The indicator applies classic Supertrend logic: the trend is considered up when the price is above the Supertrend line and down when below. Different line styles and thicknesses visually distinguish the timeframes. This tool supports multi-timeframe analysis by providing the main directional trend from the larger timeframe, refined positioning from the middle timeframe, and specific entry points from the smallest timeframe. It is applicable across various markets including Forex, indices, commodities, stocks, and cryptocurrencies, and supports symbols such as BTCUSD, EURUSD, GBPUSD, XAUUSD, NAS100, and USDJPY.
Indicator profile
Customer reviews
4.5
Reviews: 2
5 | 50 % | |
4 | 50 % | |
3 | 0 % | |
2 | 0 % | |
1 | 0 % |
Customer reviews
October 13, 2025
The part worth keeping is the setup needs a cleaner reason to exist, and a few ugly trades are useful in the sample.
October 10, 2025
Discussion
FAQ
BTCUSD
Forex
Breakout
Indices
EURUSD
Commodities
GBPUSD
NZDUSD
Prop
Scalping
Crypto
Stocks
XAUUSD
NAS100
USDJPY
Products available through cTrader Store, including trading bots, indicators and plugins, are provided by third-party developers and made available for informational and technical access purposes only. cTrader Store is not a broker and does not provide investment advice, personal recommendations or any guarantee of future performance.


Price
Since 05/01/2025
14
Sales