Brokers & props
For business
00
Days
:
00
Hours
:
00
Minutes
:
00
Seconds
Indicator
RSI
Indices
Prop
Breakout
Commodities
Stocks
Forex
MACD
Crypto
ZigZagColor
22/10/2025
3
Desktop
Since 30/09/2024
Sales
43
"ZigZagColor" uploaded image"ZigZagColor" uploaded image

Overview

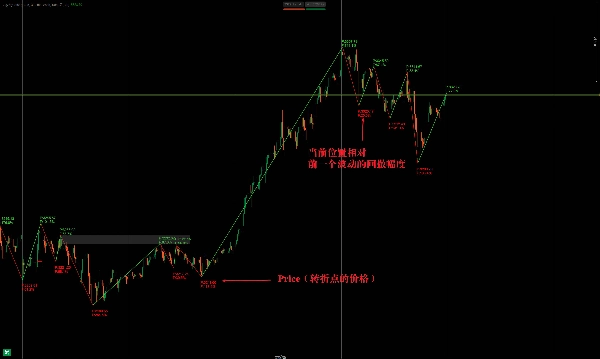
The ZigZag indicator is a technical analysis tool primarily used to identify key price reversal points by filtering out market noise. It connects significant highs and lows with ZigZag lines, helping traders visualize trends and potential breakouts.

How ZigZag Works

  1. Core Functionality
    • It eliminates minor price fluctuations by setting a minimum price change threshold (percentage or fixed value).
    • Only connects meaningful swing highs/lows, simplifying trend analysis.
    • Often used to detect support/resistance levels, reversals (e.g., head & shoulders, double tops/bottoms).
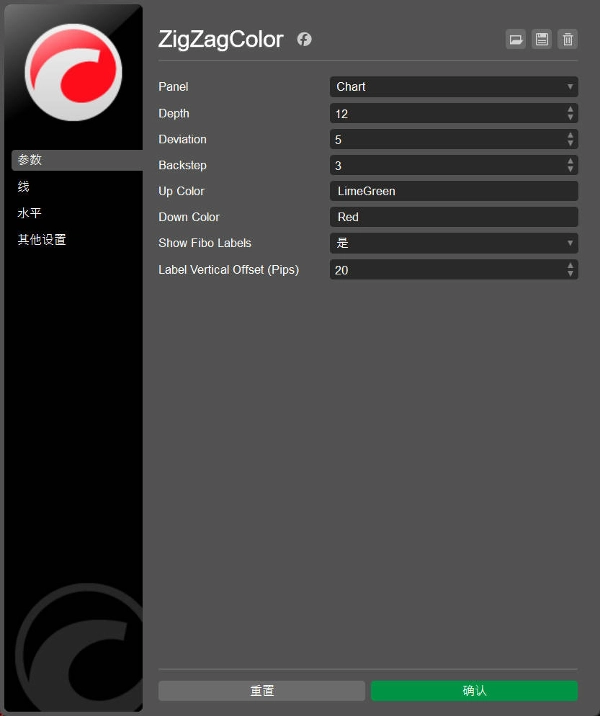
  2. Key Parameters
    • Minimum Price Movement (%): Determines sensitivity (e.g., 5% ignores moves smaller than this).
    • Lookback Depth: Controls how many past candles are analyzed, affecting lag.

Primary Applications

1. Trend Identification

  • Uptrends: Higher highs (HH) + higher lows (HL).
  • Downtrends: Lower highs (LH) + lower lows (LL).
  • Helps draw trendlines for potential breakout trades.

2. Pattern Recognition

  • Reveals classic chart patterns (triangles, flags, wedges) by defining swing points.

3. Fibonacci Retracement Levels

  • Marks clear swing highs/lows for Fibonacci extensions or retracements.

4. Divergence Detection

  • Highlights divergences between price and oscillators (RSI, MACD).


ZigZag 指标是一种用于技术分析的工具,主要用于识别价格趋势中的关键转折点,帮助交易者过滤市场噪音,突出重要的高点和低点。以下是其核心要点及用法:

ZigZag 指标的原理

  1. 基本功能
    • 通过设定价格波动的阈值(百分比或固定值),自动忽略小幅波动,仅连接显著的高点和低点,形成折线(ZigZag 形态)。
    • 常用于辅助识别支撑/阻力位、趋势反转(如头肩顶、双底等形态)。
  2. 核心参数
    • 最小波动幅度(如5%或点数):决定过滤小波动的灵敏度。值越大,信号越少但更可靠。
    • 回溯深度:控制计算时参考的K线数量,影响转折点的延迟性。

主要用途

  1. 趋势识别
    • 通过连续的高点抬高(上升趋势)或低点降低(下降趋势)判断趋势方向。
    • 结合趋势线,可提前预判突破或回调。
  2. 形态分析
    • 识别经典价格形态(如三角形、旗形),ZigZag 线条能清晰显示形态边界。
  3. 斐波那契工具配合
    • 用ZipZag标记的波段高/低点,作为斐波那契回撤或扩展的起点/终点。
  4. 背离检测
    • 价格与指标(如RSI、MACD)出现背离时,ZipZag帮助确认背离段的起点和终点。
0.0
Reviews: 0
Customer reviews
No reviews for this product yet. Already tried it? Be the first to tell others!
More from this author
Indicator
Indices
Breakout
Prop
+4
Pivot Points Daily Session
Pivot Point with base zone daily Asia-London-New york Session.
Indicator
Indices
Prop
Stocks
+3
IRiskRewardTools
Risk Reward Management Tools(风险回报管理工具)
Indicator
VWAP
Indices
Prop
+4
Volume Weighted Average Price
VWAP is a powerful tool for intraday traders
Indicator
Indices
Breakout
Prop
+4
Higher TimeFrame Candle Tracker
Higher TimeFrame Candle Tracker: Current Timeframe (Any TimeFrame) Show High TimeFrame Candle Bar
Indicator
Indices
RSI
Prop
+4
SuperEmaColorRSI
This is a super indicator that integrates the RSI indicator with a dual moving average system.
Indicator
Indices
Breakout
Commodities
+3
Daily Levels
The "Daily Levels" indicator is used to display last week's and yestoday high/low price
You may also like
KDJ
The KDJ oscillator display consists of 3 lines (K, D and J - hence the name of the display) and 2 levels.
Indicator
Grid
RSI
Breakout
+14
StopATR
Displays a dynamic stop loss line based on the Average True Range (ATR), helping traders visualize volatility-based risk
Cumulative Delta Candles + VolumeProfile
Cumulative delta candles + volume profile
Indicator
NAS100
NZDUSD
Martingale
+26
MACD ColorFlow Moving Average v1
MACD ColorFlow Moving Average, A clean, visual trend line driven by MACD momentum.
Indicator
Breakout
Bollinger
Pressure Scanner
Pressure Scanner is a volatility-and-momentum to show both pressure states (squeeze on/off) and directional
E7 Polynomial Regression Channel
Polynomial Regression Channel which also reflects the volatility of the underlying asset.
Laguerre RSI
Laguerre RSI is based on John EHLERS' Laguerre Filter to avoid the noise of RSI.
Indicator
FVG
Fibonacci
Fair Value Gap (Extended)
Detect FVGs with age, status, Fibonacci levels, and customizable fill threshold—extended version.
Indicator
XAUUSD
Commodities
Signal
+1
Gold Order Block Finder
Gold Market Maker Zones; Non-repainting Supply & Demand detector for XAUUSD. Precise institutional zones for cTrader.
Indicator
Stocks
Commodities
Forex
buy sell
SmartSignal Pro: Precise BUY/SELL signals to profit in any market. Trade like a pro! 🚀
Indicator
NAS100
NZDUSD
Martingale
+22
Zigzag Trend
The ZigZag Trend is a market structure tool that filters out small price fluctuations and highlights major swing.
Indicator
Indices
RSI
Prop
+4
CG Swing Signal
One of the best indicators we have ever developed, with a very high profit ratio.
Indicator
NAS100
NZDUSD
Martingale
+26
Info Dashboard_noSourceCode
Read the market with AI: live sentiment, news impact, equity, spread & neural net signals in one dashboard.
Range 10 Rsi
RSI Scalping cBot: quick‑fire trades on choppy symbols.
Indicator
RSI
Breakout
Signal
+1
Dynamic Trend Gradient
Identifies trends with moving averages & volatility. Base levels = bullish 🐂 or bearish 🐻 signals. Reversals detected!
Indicator
Grid
XAUUSD
Breakout
+12
heatmap kopie
Dynamic Liquidity Depth exposes hidden volume
Indicator
Indices
Breakout
Stocks
+2
VegaXLR - cTrader Pitchfork & Channel Enhancer
Enhance Pitchfork & Price Channels in cTrader with customizable Equidistant and Fibonacci levels.
Indicator
Breakout
Stocks
Signal
Darvas Box
The Darvas Box involves identifying "boxes" or trading ranges where a stock's price consolidates before breaking out.