
Description
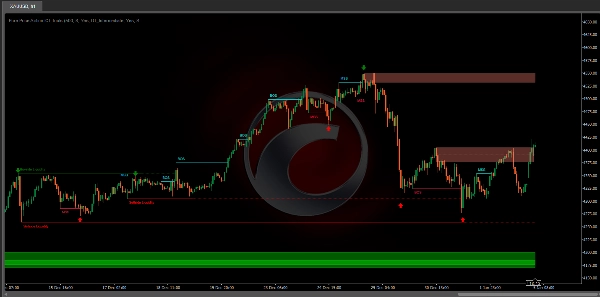
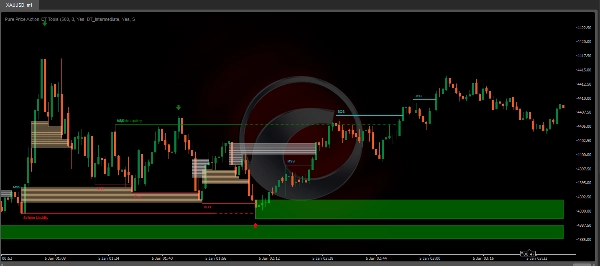
The Pure Price Action ICT Tools indicator is designed for pure price action analysis, automatically identifying real-time market structures, liquidity levels, order & breaker blocks, and liquidity voids.
Its unique feature lies in its exclusive reliance on price patterns, without being constrained by any user-defined inputs, ensuring a robust and objective analysis of market dynamics.
Key Features
- Market Structures
A Market Structure Shift, also known as a Change of Character (CHoCH), is a pivotal event in price action analysis indicating a potential change in market sentiment or direction. An MSS occurs when the price reverses from an established trend, signaling that the prevailing trend may be losing momentum and a reversal might be underway. This shift is often identified by key technical patterns, such as a higher low in a downtrend or a lower high in an uptrend, which indicate a weakening of the current trend's strength.
A Break of Structure typically indicates the continuation of the current market trend. This event occurs when the price decisively moves beyond a previous swing high or low, confirming the strength of the prevailing trend. In an uptrend, a BOS is marked by the price breaking above a previous high, while in a downtrend, it is identified by the price breaking below a previous low.
While a Market Structure Shift (MSS) can indicate a potential trend reversal and a Break of Structure (BOS) often confirms trend continuation, they do not assure a complete reversal or continuation. MSS and BOS levels can also function as liquidity zones or areas of price consolidation rather than definitively signaling a change in market direction. Traders should approach these signals cautiously and validate them with additional factors before making trading decisions. For further details on other components of the tool, please refer to the following sections.
- Order & Breaker Blocks
Order and Breaker Blocks are key concepts in price action analysis that help traders identify significant levels in the market structure.
Order Blocks are specific price zones where significant buying or selling activity has occurred. These zones often represent the actions of large institutional traders or market makers, who execute substantial orders that impact the market.
Breaker Blocks are specific price zones where a strong reversal occurs, causing a break in the prevailing market structure. These blocks indicate areas where the price encountered significant resistance or support, leading to a reversal.
In summary, buy-side and sell-side liquidity provide crucial insights into market demand and supply dynamics, helping traders make informed decisions based on the availability of orders at different price levels.
- Buyside & Sellside Liquidity
Both buy-side and sell-side liquidity zones are critical for identifying potential turning points in the market. These zones are where significant buying or selling interest is concentrated, influencing future price movements.
In summary, buy-side and sell-side liquidity provide crucial insights into market demand and supply dynamics, helping traders make informed decisions based on the availability of orders at different price levels.
- Liquidity Voids
Liquidity voids are gaps or areas on a price chart where there is a lack of trading activity. These voids represent zones with minimal to no buy or sell orders, often resulting in sharp price movements when the market enters these areas.
In summary, liquidity voids are crucial areas on a price chart characterized by a lack of trading activity. These voids can lead to rapid price movements and increased volatility, making them essential considerations for traders in their analysis and decision-making processes.
- Swing Points
Reversal price points are commonly referred to as swing points. Traders often analyze historical swing points to discern market trends and pinpoint potential trade entry and exit points.
Do note that in this script these are subject to back painting, that is they are not located where they are detected.
The detection of swing points and the unique feature of this script rely exclusively on price action, eliminating the need for numerical user-defined settings. The process begins with detecting short-term swing points:
- Short-Term Swing High (STH): Identified as a price peak surrounded by lower highs on both sides.
- Short-Term Swing Low (STL): Recognized as a price trough surrounded by higher lows on both sides.
Intermediate-term and long-term swing points are detected using the same approach but with a slight modification. Instead of directly analyzing price candles, previously detected short-term swing points are utilized. For intermediate-term swing points, short-term swing points are analyzed, while for long-term swing points, intermediate-term ones are used.
This method ensures a robust and objective analysis of market dynamics, offering traders reliable insights into market structures. Detected swing points serve as the foundation for identifying market structures, buy-side/sell-side liquidity levels, and order and breaker blocks presented with this tool.
In summary, swing points are essential elements in technical analysis, helping traders identify trends, support, and resistance levels, and optimal entry and exit points. Understanding swing points allows traders to make informed decisions based on the natural price movements in the market.
Settings
- Market Structures
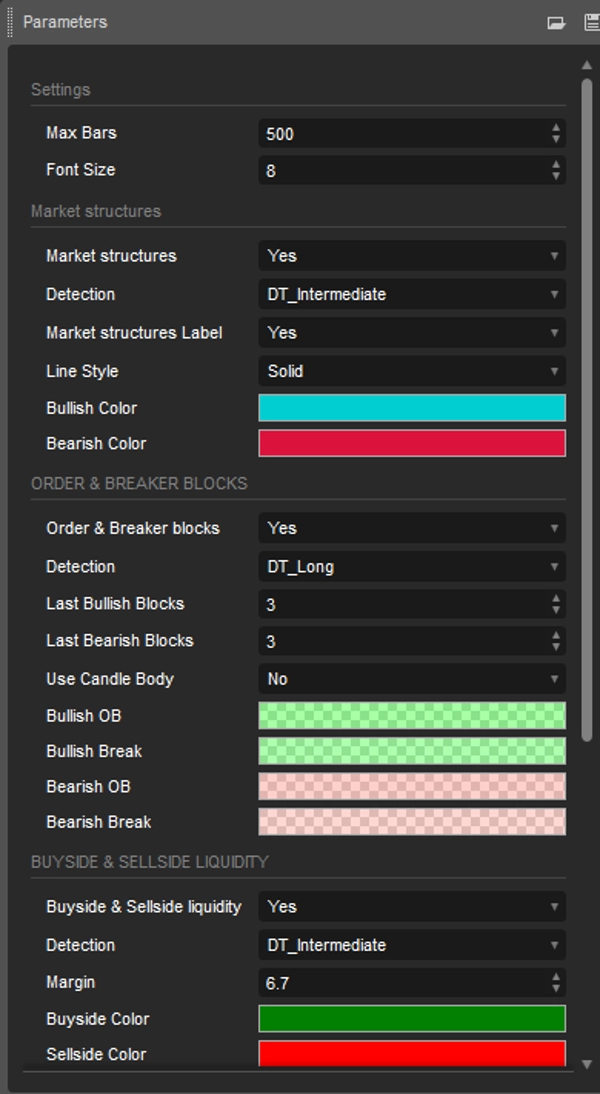
Market Structures: Toggles the visibility of the market structures, both shifts and breaks.
Detection: An option that allows users to detect market structures based on the significance of swing levels, including short-term, intermediate-term, and long-term.
Market Structure Labels: Controls the visibility of labels that highlight the type of market structure.
Line Style: Customizes the style of the lines representing the market structure.
- Order & Breaker Blocks
Order & Breaker Blocks: Toggles the visibility of the order & breaker blocks.
Detection: An option that allows users to detect order & breaker blocks based on the significance of swing levels, including short-term, intermediate-term, and long-term.
Last Bullish Blocks: Number of the most recent bullish order/breaker blocks to display on the chart.
Last Bearish Blocks: Number of the most recent bearish order/breaker blocks to display on the chart.
Use Candle Body: Allows users to use candle bodies as order block areas instead of the full candle range.
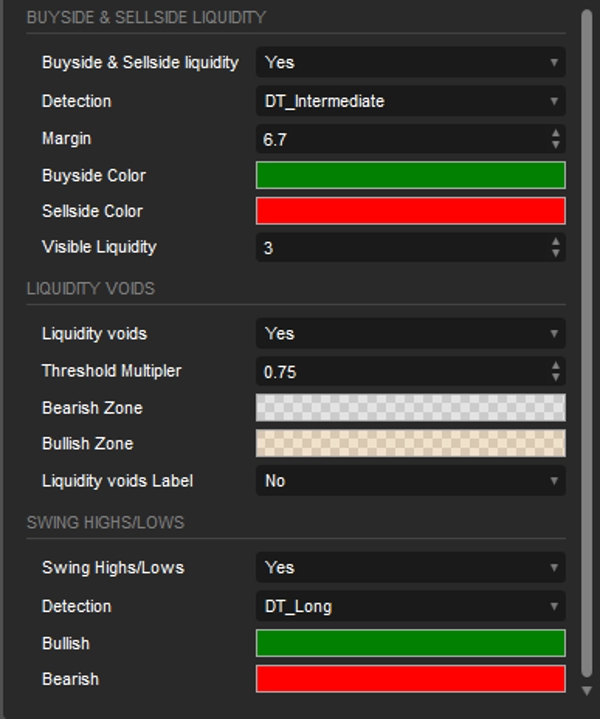
- Buyside & Sellside Liquidity
Buyside & Sellside Liquidity: Toggles the visibility of the buyside & sellside liquidity levels.
Detection: An option that allows users to detect buy-side & sell-side liquidity based on the significance of swing levels, including short-term, intermediate-term, and long-term.
Margin: Sets margin/sensitivity for a liquidity level detection.
Visible Liquidity : Controls the amount of the liquidity levels/zones to be visualized.
- Liquidity Voids
Liquidity Voids: Enable display of both bullish and bearish liquidity voids.
Threshold Multiplier: Defines the multiplier for the threshold, which is hard-coded to the 200-period ATR range.
Label: Enable display of a label indicating liquidity voids.
- Swing Points
Swing Highs/Lows: Toggles the visibility of the swing levels.
Detection: An option that allows users to detect swing levels based on the significance of swing levels, including short-term, intermediate-term, and long-term.
Summary
Key functionalities include:
- Market Structures: Detects Market Structure Shifts (potential trend reversals) and Breaks of Structure (trend continuations) based on price patterns.
- Order & Breaker Blocks: Highlights significant price zones where institutional buying/selling or strong reversals occur.
- Buy-side & Sell-side Liquidity: Identifies zones of concentrated buying or selling interest that may influence price movements.
- Liquidity Voids: Marks price chart gaps with minimal trading activity, often leading to sharp price moves.
- Swing Points: Detects short-, intermediate-, and long-term reversal points to aid in trend analysis and trade decision-making.
The tool offers customizable settings to toggle visibility and detection sensitivity for each feature, including options to adjust detection based on swing level significance and display preferences. It supports analysis across various markets such as Forex, Crypto (e.g., BTCUSD), and indices (e.g., NAS100, XAUUSD). The indicator provides an objective framework for analyzing market dynamics based solely on price action patterns.
Customer reviews
5 | 67 % | |
4 | 0 % | |
3 | 33 % | |
2 | 0 % | |
1 | 0 % |


!["[Hamster-Coder] Pivot Points MTF" logo](https://cdn.ctrader.com/image/webp/4c143e5a-309c-40e3-a578-f04d1e133ffa_31159)
!["[CB] Pivot Points Pro" logo](https://cdn.ctrader.com/image/webp/43463c82-67b0-4f10-a4ba-901bba091d81_32594)


