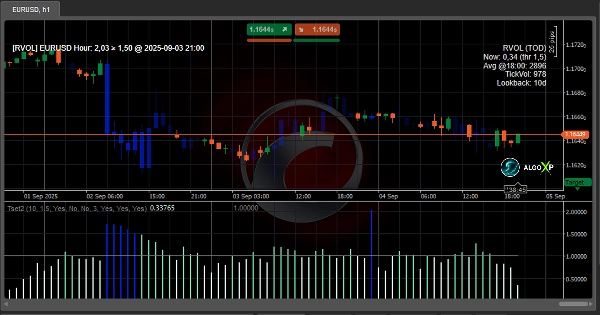
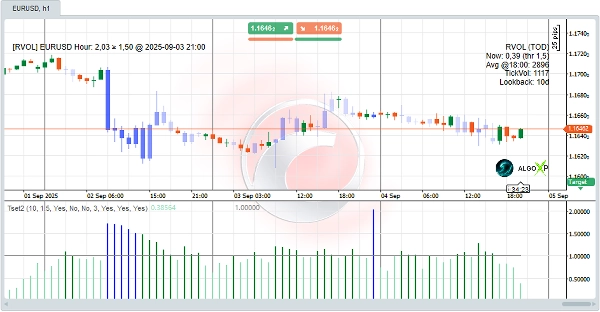
Indicator
forex
indices
gbpusd
commodities
xauusd
nas100
nzdusd
prop
btcusd
eurusd
usdjpy
crypto
stocks
"Tsunami Volume Surge - RVOL" logo
Tsunami Volume Surge - RVOL
0.0
07/09/2025
0
Desktop

🌊 Tsunami Volume Surge(RVOL + Time-of-Day) is a cTrader indicator designed to show traders when the market is truly active. Instead of looking only at absolute volume, it compares current market activity with its usual levels at the same time of day.

The main idea is simple: if volume is significantly higher than normal, the move is more likely driven by real market participants and has greater strength. The indicator highlights these situations using a color-coded histogram, bar coloring on the chart, and convenient alerts.

📊 How to use 

There are many ways to use Tsunami Volume Surge:

Visual confirmation
Colored candles make it easy to see which bars have real energy behind them, without staring at numbers.ts.

Filter weak signals
If volume is below normal (RVOL < 1.0), the market lacks interest. Avoid signals during such conditions.

Confirm breakouts
A breakout supported by high RVOL is far more reliable than one on low volume. Quasar Volume helps you spot the difference.

Time-of-day analysis
Different markets have their own rhythm. This indicator shows at which hours a symbol usually becomes active.

News trading
During major news events, RVOL often spikes. Setting a higher threshold (e.g. 3.0) helps you catch these explosive moves.


✅ Main Features

  • Automatic Relative Volume (RVOL) calculation — instantly shows when market activity is above or below its usual level.
  • Color-coded histogram — clear visual separation of low, normal, and high volume bars.
  • Dynamic candle coloring — bars are tinted based on strength of volume; the bigger the surge, the stronger the highlight.
  • Configurable thresholds — set your own sensitivity (e.g. 1.5 for scalping, 3.0 for news trading).
  • Alerts & pop-ups — get notified when volume crosses your chosen threshold, with time and date.
  • Info panel — displays live RVOL values, averages, and settings at a glance.
  • Baseline line (1.0) — quick reference to normal activity levels.
  • Lightweight and fast — designed to run smoothly even on low timeframes (M1, M5).

🎯 Perfect for

  • Algo developers — RVOL values can be used as a filter or condition in automated cBots.ar shading make the trend easy to read.
  • Scalpers — confirm if a breakout or micro-trend has real strength behind it.
  • Intraday traders — identify the most active times of day and avoid quiet periods.
  • Swing traders — filter false moves and focus only on breakouts with strong participation.
  • News traders — instantly see volume spikes during economic releases and react faster.
  • Beginner traders — simple and intuitive visuals make it easy to understand when the market is “alive” or “dead”.
More from this author
Indicator
forex
prop
usdjpy
JPY Samurai Breakout Lite
⚔️ JPY Samurai Breakout Lite — Simple Breakout Indicator for cTrader ⚔️
Indicator
forex
breakout
prop
+1
JPY Samurai Breakout Pro
⚔️ JPY Samurai Breakout Pro — Professional Breakout Indicator for cTrader ⚔️
cBot
forex
prop
commodities
+3
Maya Gold Grid ATR - TEST VERSION
🌞 Maya Gold Grid ATR is a professional trading robot designed exclusively for XAUUSD (Gold) on the cTrader .🌞
Indicator
forex
indices
gbpusd
+10
Nebula Range Filter Pro
⚡Nebula Range Filter is a professional trend filter indicator for cTrader⚡
cBot
forex
prop
xauusd
+3
Maya Gold Grid ATR
🌞 Maya Gold Grid ATR is a professional trading robot designed exclusively for XAUUSD (Gold) on the cTrader .🌞
You may also like
Free Volume Profile v2.0
Indicator
rsi
macd
sarah trend
Un indicateur tout-en-un intelligent qui détecte la tendance, donne un avis clair (achat/vente)
Indicator
breakout
indices
vwap
+4
ProVWAP
Advanced Anchored VWAP for cTrader: volatility bands, real‑time alerts & customizable session resets.
Indicator
bollinger
indices
rsi
+1
[Stellar Strategies] QQE
The QQE indicator is a technical analysis tool designed to identify potential trend changes and trading signals 📈📉
Time zone pro
FREE Global Trading Sessions Indicator
RangeBoxLevel
This technical analysis indicator provides information on market sentiment, trend and price levels....
Indicator
forex
crypto
stocks
PinBarCandlestickPattern
PinBarCandlestickPattern Indicator
Pivot Points Clasic,FIBO,etc
All-in-one Pivot Indicator: set Classic, Fibo, Woodie, Camarilla, Demark methods, style levels & labels your way ;)
VWAP Tank Btn
Custom Vwap Indicator
IR Slowing Moving
Add Slowing to IR Moving Average.
Ctrader Liniar Chart
Simple and efficient Indicator Designed to be profitable .With alarms for trend changes and support - resistance
VGM - Auto Fibo Retracement
Auto Fibonacci Retracement Indicator.
ZigZagSmartAlert_demo
ZigZag Smart Alert DEMO for cTrader DEMO VERSION 24 hours free trial! This is a DEMO version of the ZigZag Smart Aler
Indicator
eurusd
Compare Symbol
Plots chosen symbol's close price, candlestick (wick, body) on cTrader chart, supports multiple timeframes.
RT Relative Moving Average
Bring the RMA to cTrader! This is the Relative Moving Average from TradingView.
Range 10 Rsi
RSI Scalping cBot: quick‑fire trades on choppy symbols.
Indicator
forex
breakout
btcusd
+9
Advanced HTF Trend Buy & Sell Trading System
Detects breakouts 📈 auto-draws levels 🚀 confirms trends 🐻 dynamic signals 🎨 customizable for any asset & timeframe.
Indicator
bollinger
indices
rsi
+2
[Stellar Strategies] Ultimate Trend & Momentum Dashboard
A comprehensive cTrader indicator designed to give you a quick, at-a-glance understanding of market sentiment 📈📉