MARCs_MARKET_OVERVIEW_PRO
Indicatore
Versione 1.0, Aug 2026
Windows, Mac
Trading product for MARCs_MARKET_OVERVIEW_PRO Indicatore Key Levels RSI, image 2
Trading product for MARCs_MARKET_OVERVIEW_PRO Indicatore Key Levels RSI, image 3
Trading product for MARCs_MARKET_OVERVIEW_PRO Indicatore Key Levels RSI, image 4
Trading product for MARCs_MARKET_OVERVIEW_PRO Indicatore Key Levels RSI, image 5
Trading product for MARCs_MARKET_OVERVIEW_PRO Indicatore Key Levels RSI, image 6
Trading product for MARCs_MARKET_OVERVIEW_PRO Indicatore Key Levels RSI, image 7
Trading product for MARCs_MARKET_OVERVIEW_PRO Indicatore Key Levels RSI, image 8
Trading product for MARCs_MARKET_OVERVIEW_PRO Indicatore Key Levels RSI, image 9
Trading product for MARCs_MARKET_OVERVIEW_PRO Indicatore Key Levels RSI, image 10
Da 24/06/2026
1
Installazioni gratuite

Descrizione

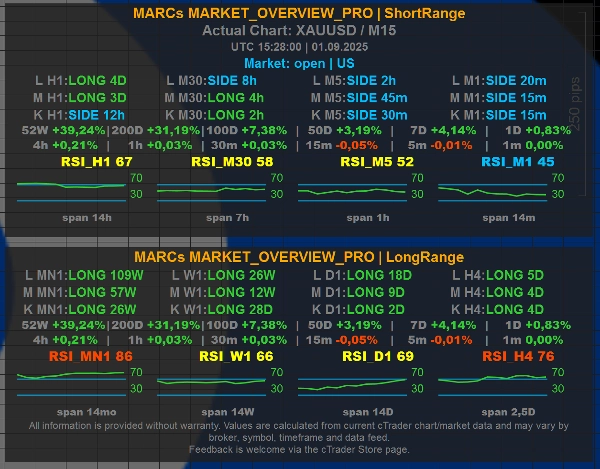
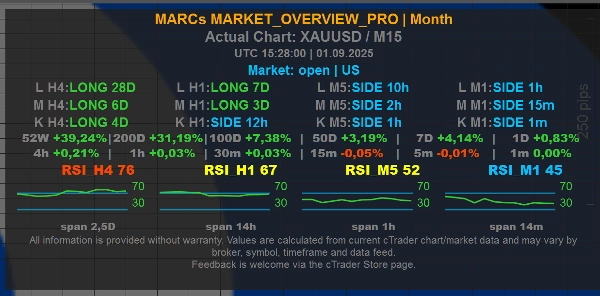
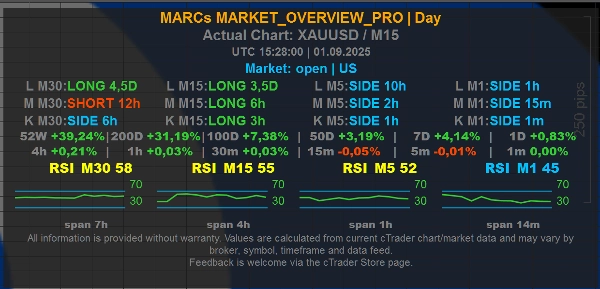
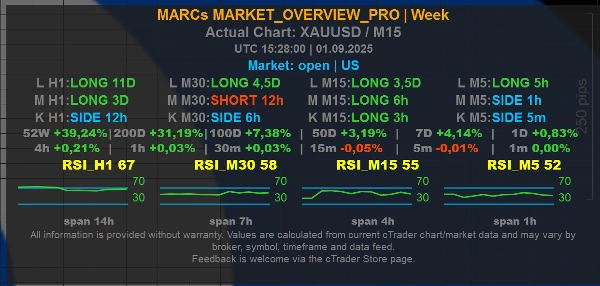
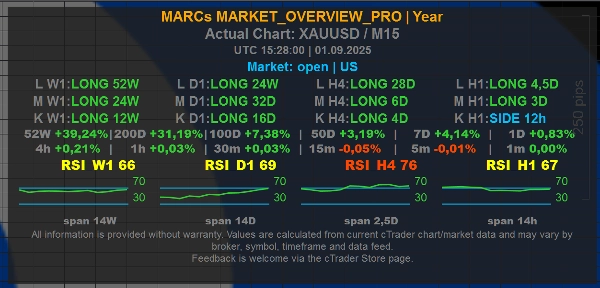
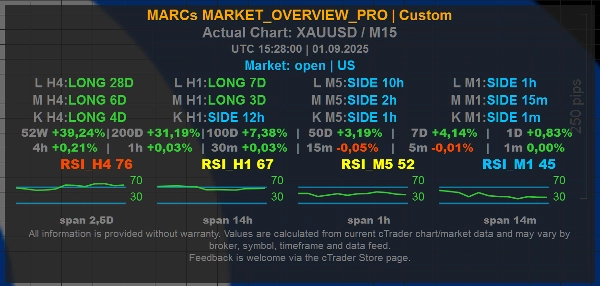
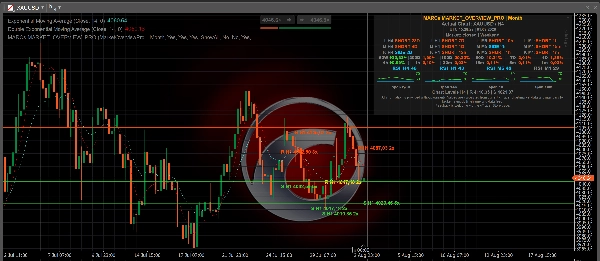
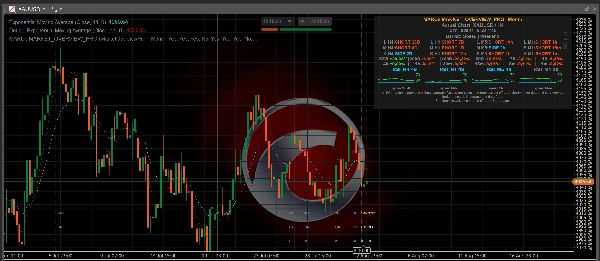
MARCs MARKET_OVERVIEW_Pro is a multi-timeframe market overview indicator for cTrader.


It displays a compact on-chart dashboard with trend context, RSI readings, market/session information and configurable time-horizon presets. The indicator was originally developed around XAUUSD / Gold analysis, but is designed to work as a general market overview tool on any available chart symbol, depending on broker data quality and available market history.


Main features:

- Multi-timeframe trend rows for short, medium and long market context

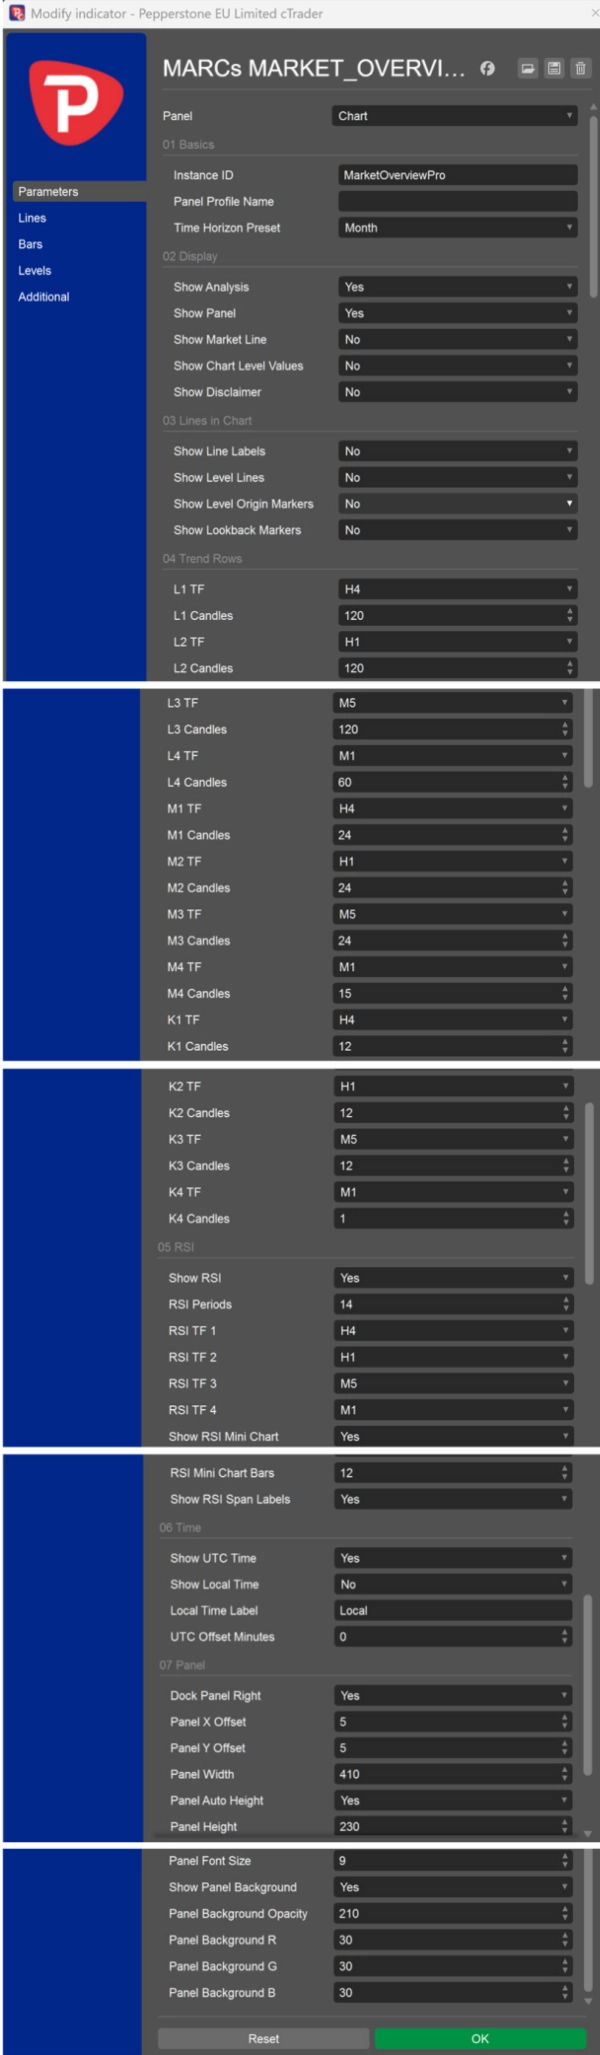
- Configurable Day, Week, Month, Year, ShortRange, LongRange and Custom presets

- RSI values and mini RSI charts across selected timeframes

- Optional UTC and local time display

- Optional market/session line

- Optional chart-level reference lines

- Optional chart-level values shown directly in the panel


Level Lines and Chart Level Values:

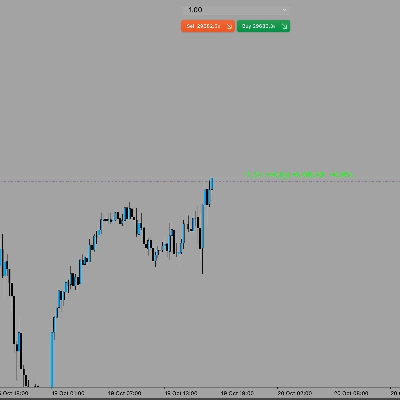
The optional Show Level Lines setting can display calculated chart reference levels from one selected timeframe: M1, M5, M15, M30, H1, H4, D1, W1 or MN1. For these individual timeframe selections, the indicator shows the nearest calculated resistance above the current price and the nearest calculated support below the current price. ShowAll displays the broader H1 level set from the existing H1 level calculation. No keeps level lines hidden.


The optional Show Chart Level Values setting can show the same nearest resistance/support reference values directly in the panel without drawing lines on the chart. The panel line is labelled, for example, "Chart Levels H1 | R ... | S ..." to make clear that the values refer to chart-level references.


How Level Lines are calculated:

The levels are derived from past swing highs and swing lows in the selected timeframe. Nearby swing points are grouped into level clusters, and only areas with enough repeated touches are shown. This makes the lines visual market-context markers based on available chart history.


Important:

MARCs Market Overview Pro is an analysis-only market overview tool. It does not place trades, manage positions, provide investment advice or guarantee trading results.


Level Lines are not buy signals, sell signals, stop-loss recommendations, take-profit recommendations or investment advice. They do not predict that price will reverse, break out or react at a specific level.


All readings depend on the available cTrader chart data, broker symbol feed, timeframe and market history. Values may differ between brokers, symbols and data feeds.


Trading involves risk. Past performance does not guarantee future results.

Riepilogo

Riepilogo AI
MARCs MARKET_OVERVIEW_Pro is a multi-timeframe market overview indicator designed for the cTrader platform. It provides a compact on-chart dashboard that displays trend context across short, medium, and long timeframes, RSI values with mini RSI charts, and market/session information. Users can configure time-horizon presets including Day, Week, Month, Year, ShortRange, LongRange, and Custom settings.
The indicator supports optional display of UTC and local times, market/session lines, and chart-level reference lines. These reference lines represent calculated support and resistance levels derived from clusters of past swing highs and lows on selected timeframes ranging from 1 minute to monthly intervals. Users can choose to show these levels as lines on the chart or as numeric values within the dashboard panel.
Originally developed with a focus on XAUUSD (Gold), MARCs MARKET_OVERVIEW_Pro is adaptable to any chart symbol supported by the broker’s data feed and market history. It serves as an analysis tool providing visual market structure and momentum insights but does not execute trades or offer trading advice. The indicator’s readings depend on the quality and availability of broker data and chart history.
Profilo indicatore
Categoria indicatore
Struttura del mercato (SMC)
Tipo di output
Visualizzazione
Filtro
Requisiti per i dati
Solo barre
Segnali supportati
Forza del trend
Livello raggiunto

Recensioni dei clienti

0.0
Recensioni: 0
Recensioni dei clienti
Questo prodotto non ha ancora ricevuto recensioni. L'hai già provato? Fallo sapere agli altri per primo!

Discussioni

Domande frequenti

Key Levels
RSI
Market Structure
Risk Dashboard
Support & Resistance
I prodotti disponibili tramite cTrader Store, inclusi bot di trading, indicatori e plugin, sono forniti da sviluppatori terzi e resi disponibili esclusivamente a scopo informativo e di accesso tecnico. cTrader Store non è un broker e non fornisce consulenze in materia di investimento, raccomandazioni individualizzate o garanzie di risultati futuri.

Altro da questo autore

Indicatore
RSI
Key Levels
+3
MARKs Free XAUUSD market overview dashboard with trend rows, RSI context, sessions and fixed Day/Month presets.
cBot
Conservative
Fixed Risk %
+5
MARCs GOLD H4-Gold-Swing-Bot for XAUUSD with transparent long-term backtests and optional reserve/guard system.
3.01
Fattore di profitto

Potrebbe interessarti anche

Indicatore
MACD
Prop
+14
Customize the MACD! Choose colors, get real-time tick updates, and see crossover points for enhanced trading precision.
Indicatore
VWAP
Volume
+5
Institutional Session VWAP + 3-Sigma Bands & HUD. Engineered for high-precision Index & Prop Firm Scalping.
Indicatore
AI
ATR
+26
MacD Custom Indicator-Multiple Time Frame
Indicatore
Prop
Forex
+13
Color Volume Bars – Visualize Market Strength Instantly
Indicatore
Triangle
Double Top
+5
Know which liquidity sweeps are real. Auto-tracks EQH/EQL and confirms genuine reversals, not just broken levels.
Indicatore
Flag
VWAP
+5
Session VWAP with statistical deviation bands, gradient cloud, and live rejection alerts — see exactly how stretched pri
Indicatore
Forex
cTrader ZigZag Alerts: Precision Swing Detection, Alerts, and Fibonacci.
Indicatore
Drawdown Monitor
Proprietary trading desk risk monitoring dashboard!
Indicatore
Imbalance
Inside Bar
+3
A clean and powerful Smart Money Concepts tool combining Fair Value Gaps, Previous Daily High/Low, Inside/Outside bar
Indicatore
Signal
Breakout
+1
Bolliger Bands + Hamster-Coder™ Timeframe Decoupling
Indicatore
Forex
BTCUSD
+13
Multi-symbol Inside Bar Scanner with dashboard & breakout alerts
Indicatore
ATR
BOS
+5
Full ICT/SMC 4-step setup checker that alerts a long or short setup.
Indicatore
ATR
RSI
+24
Daily moving averages, simplified. Displays 3 daily moving averages on lower timeframes with selectable MA types.
Indicatore
Smart Liquidity Zones PRO auto-detects liquidity grabs, wicks, traps & manipulations — trade like the smart money.
Indicatore
ATR
RSI
+5
Delta RSI Candle Pro, the indicator that transforms ordinary candlesticks into powerful momentum visualizers.
Indicatore
CandleCounterAlex – Candle Cycle Counter with Colors and Adjustable Position.
Indicatore
Prop
Forex
+9
Average Cost Price helps you keep track of your open positions on the chart. In doing so, it provides lines and explanat
Indicatore
ATR
SMC
+2
Auto Fibonacci Retracement Pro – Smart Swing & Golden Zone Levels

Prezzo

Da 24/06/2026
1
Installazioni gratuite