
Description
GOLD SENTINEL - A CANDLE-COLORING INDICATOR THAT FILTERS SIDEWAYS MARKETS FOR GOLD
v1.0
- WHAT IT DOES
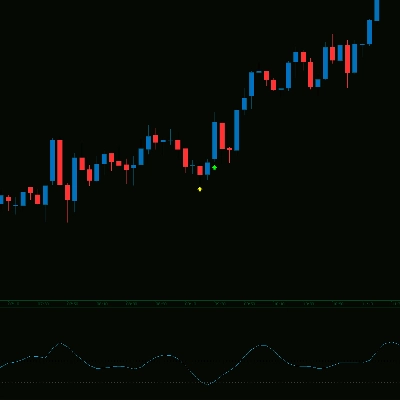
- Colors candles by market state
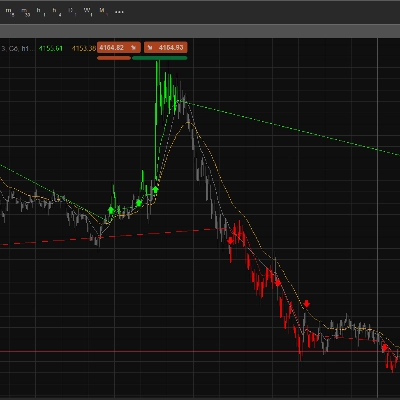
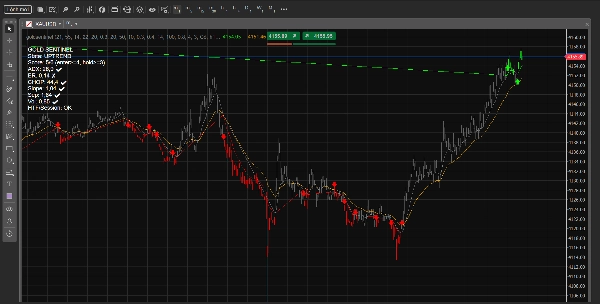
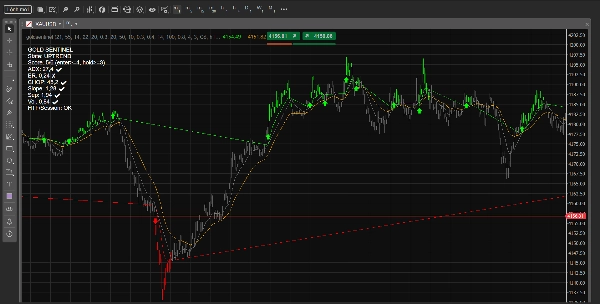
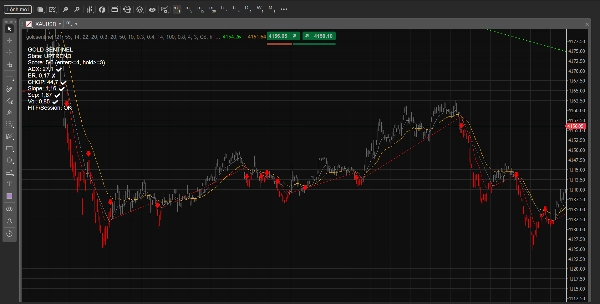
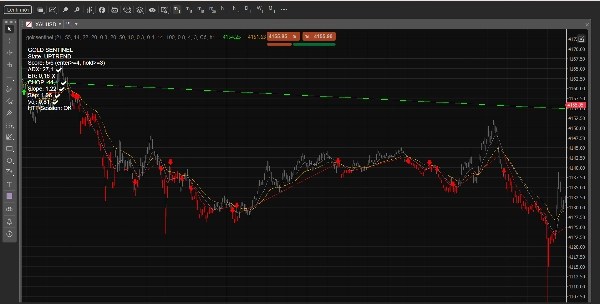
- Green candle: uptrend that is strong enough
- Red candle: downtrend that is strong enough
- Gray candle: sideways or weak trend, stay out
- It doesn't predict price, it only classifies the market
- HOW IT DECIDES
Direction, all 3 must be true:
- Fast EMA is above (or below) the slow EMA
- Price is on the same side of the slow EMA
- DI+ and DI- agree
Quality, 6 filters, 1 point each:
- ADX high enough
- Efficiency Ratio high enough (price moves straight, little chop)
- Choppiness Index low (not choppy)
- Slow EMA slopes enough, in the right direction
- Fast and slow EMA far enough apart
- ATR not too low versus its average (removes dead markets)
Enough points and the candle turns green or red. Not enough and it stays gray.
- NO FLICKERING
- To enter a trend: needs 4/6 or more
- Once in a trend: 3/6 is enough to keep the color
- So candles don't flip color constantly around the threshold
- TWO MANDATORY FILTERS (can be switched off)
- Higher timeframe: direction must match the higher timeframe EMA, uses the closed bar so it doesn't repaint
- Session (UTC): outside the chosen hours it counts as sideways
- WHAT YOU SEE ON THE CHART
- Candles change color, colors are adjustable
- Arrow when a new trend starts (drawn on the closed candle, no repaint, 1 candle late)
- Info panel in the top-left: state, score, which filters pass and which fail
- 2 thin EMA lines for reference
- SUGGESTED SETUP FOR GOLD ON M1
- Fast EMA 21, slow EMA 89
- ADX: period 14, min 25
- Efficiency Ratio: period 30, min 0.25
- Choppiness: period 30, max 50
- Slope: 15 bars, min 0.30
- Separation: min 0.5 ATR
- Volatility: ATR average 200, min 0.9
- Entry score 5, hold score 3
- Higher timeframe M15, EMA 50
- Session: 7 to 20 UTC (London + New York)
- This is just a starting point, backtest and tune it for your own broker
- SUGGESTED SETUP FOR GOLD ON M5
- Fast EMA 21, slow EMA 55
- ADX: period 14, min 22
- Efficiency Ratio: period 20, min 0.30
- Choppiness: period 20, max 50
- Slope: 10 bars, min 0.30
- Separation: min 0.4 ATR
- Volatility: ATR period 14, ATR average 100, min 0.8
- Entry score 4, hold score 3
- Higher timeframe H1, EMA 50
- Session: 7 to 20 UTC (London + New York), optional
- Good for intraday trend and pullback entries
- If there are too few signals, lower the entry score to 3 or ADX min to 20
- If there is still too much sideways noise, raise the entry score to 5 and turn the session filter on
SUGGESTED SETUP FOR GOLD ON M15
- Fast EMA 21, slow EMA 55
- ADX: period 14, min 20
- Efficiency Ratio: period 14, min 0.30
- Choppiness: period 14, max 55
- Slope: 8 bars, min 0.30
- Separation: min 0.35 ATR
- Volatility: ATR period 14, ATR average 100, min 0.8
- Entry score 4, hold score 3
- Higher timeframe H4, EMA 50
- Session: optional, M15 is less sensitive to Asian session noise than M5 and M1
- Good for swing-style intraday trades, fewer signals but cleaner
- If you want more signals, lower the entry score to 3
- If it flips to gray too often inside a good trend, lower the hold score to 2
QUICK COMPARISON
- M1: tightest filters (ADX 25, entry score 5), higher timeframe M15
- M5: balanced filters (ADX 22, entry score 4), higher timeframe H1
- M15: looser filters (ADX 20, entry score 4), higher timeframe H4
- Rule of thumb: the lower the timeframe, the stricter the filters, because there is more noise
- The higher timeframe should be about 3 to 4 steps above the chart timeframe
- HOW I USE IT
- Gray candle means no trade
- Only trade in the direction of the candle color, wait for a pullback then enter
- Use it with your existing system, don't enter on this indicator alone
- Prefer stretches scoring 5/6 or higher
- Stay away from big news: NFP, CPI, FOMC
- USING IT WITH A BOT
- The bot reads 3 lines: UpLine, DownLine, FlatLine
- Whichever has a value on the closed bar (Last(1)) is the current state
- NOTES
- No indicator is right 100% of the time, there is always some lag, especially at reversals
- Gold on M1 suffers from spread and slippage, test on demo first
- The live candle can change color tick by tick, so judge by closed candles
Summary
AI summary
Gold Sentinel is a candle-coloring indicator designed specifically for the gold market. It classifies market conditions into three states by coloring candles: green for a strong uptrend, red for a strong downtrend, and gray for sideways or weak trends. The indicator does not predict price movements but filters out sideways markets to highlight clearer trends.
The classification relies on three directional criteria: the fast EMA relative to the slow EMA, price position relative to the slow EMA, and agreement between DI+ and DI- indicators. Additionally, six quality filters assess trend strength and market conditions, including ADX, Efficiency Ratio, Choppiness Index, EMA slope, EMA separation, and ATR volatility. A scoring system determines candle color to reduce flickering, requiring higher scores to enter a trend and slightly lower scores to maintain it.
Two mandatory filters—alignment with a higher timeframe EMA and session time restrictions—can be enabled or disabled. The indicator displays colored candles, trend-start arrows on closed bars, an info panel with filter status and scores, and two EMA lines for reference.
Suggested setups are provided for gold on M1, M5, and M15 timeframes, with specific EMA periods, ADX thresholds, and filter parameters to balance noise and signal frequency. The indicator supports integration with trading bots via three output lines indicating trend direction or sideways market.
The classification relies on three directional criteria: the fast EMA relative to the slow EMA, price position relative to the slow EMA, and agreement between DI+ and DI- indicators. Additionally, six quality filters assess trend strength and market conditions, including ADX, Efficiency Ratio, Choppiness Index, EMA slope, EMA separation, and ATR volatility. A scoring system determines candle color to reduce flickering, requiring higher scores to enter a trend and slightly lower scores to maintain it.
Two mandatory filters—alignment with a higher timeframe EMA and session time restrictions—can be enabled or disabled. The indicator displays colored candles, trend-start arrows on closed bars, an info panel with filter status and scores, and two EMA lines for reference.
Suggested setups are provided for gold on M1, M5, and M15 timeframes, with specific EMA periods, ADX thresholds, and filter parameters to balance noise and signal frequency. The indicator supports integration with trading bots via three output lines indicating trend direction or sideways market.
Indicator profile
Indicator category
Trend
Output type
Filter
Data requirements
Bars only
Supported signals
Level touch
Trend strength
Volatility
Discussion
Customer reviews
0.0
Reviews: 0
Customer reviews
No reviews for this product yet. Already tried it? Be the first to tell others!
FAQ
ADX
EMA
ATR
Moving Average
Products available through cTrader Store, including trading bots, indicators and plugins, are provided by third-party developers and made available for informational and technical access purposes only. cTrader Store is not a broker and does not provide investment advice, personal recommendations or any guarantee of future performance.






Price
Since 26/04/2026