
Weekly Daily Levels
Indicator
2 purchases
Version 1.0, Aug 2025
Windows, Mac
5.0
Reviews: 2
Description
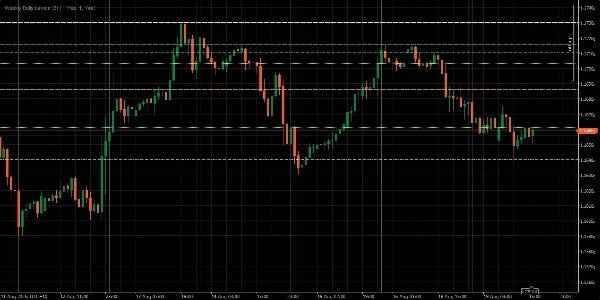
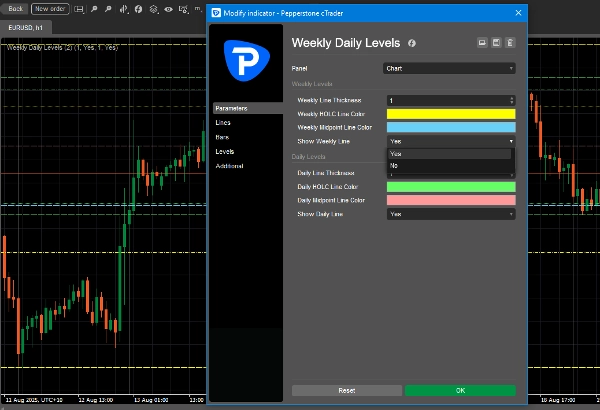
Are you relying on daily and weekly OHLC and mid-point prices in your trading strategy? Tired of marking them manually every time you take a trade?
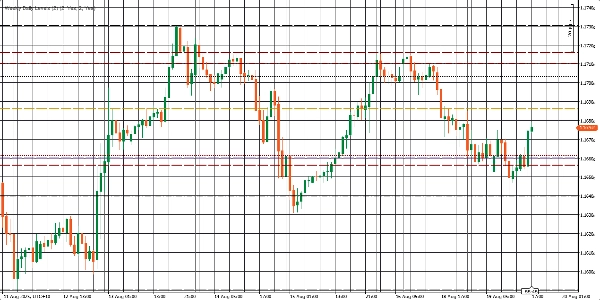
The Weekly Daily Levels Indicator does the heavy lifting for you. It automatically plots the previous day’s and previous week’s open, high, low, close (OHLC), and mid-point prices directly on your chart. This means you can concentrate on executing your strategy while the indicator takes care of the details—making your trading simpler, faster, and far more efficient.
Key Features:
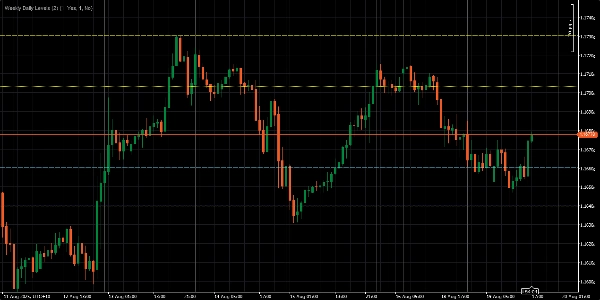
- Instantly displays daily and weekly OHLC and mid-point prices.
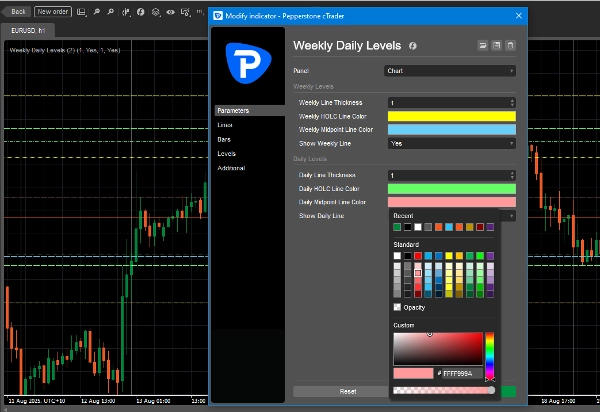
- Customize line colors to match your chart style.
- Turn daily or weekly levels on or off with a single click.
- Adjust line thickness for better visibility.
Summary
AI summary
The Weekly Daily Levels indicator automatically plots the previous day’s and previous week’s open, high, low, close (OHLC) prices along with their mid-points directly on trading charts. It provides instant visual reference to these key price levels, helping traders incorporate daily and weekly price data into their strategies without manual marking. Users can customize line colors and thickness to fit their chart style and toggle daily or weekly levels on or off with a single click. This indicator streamlines the process of tracking important historical price levels for improved trading efficiency.
Indicator profile
Customer reviews
5.0
Reviews: 2
5 | 100 % | |
4 | 0 % | |
3 | 0 % | |
2 | 0 % | |
1 | 0 % |
Customer reviews
August 28, 2025
Not bad if the rules are already clear. Two timeframes give more context.
August 21, 2025
the good surprise is the setup needs less second guessing, and It works better with a written plan.
Discussion
FAQ
Products available through cTrader Store, including trading bots, indicators and plugins, are provided by third-party developers and made available for informational and technical access purposes only. cTrader Store is not a broker and does not provide investment advice, personal recommendations or any guarantee of future performance.


!["[Hamster-Coder] Pivot Points MTF" logo](https://cdn.ctrader.com/image/webp/4c143e5a-309c-40e3-a578-f04d1e133ffa_31159)


!["High-Low Divergence [Iridio Capital]" logo](https://cdn.ctrader.com/image/webp/443c4661-7abb-40f1-842f-4b6ec560649b_40914)


Price
Since 19/04/2025
2
Sales