
LT_Ind_Candles
Indicator
4 purchases
Version 1.0, Sep 2024
Windows, Mac
4.0
Reviews: 1
Description
Note: Tested on cTrader Windows only.
Single Candle Patterns:
- Doji
- Hammer
- Shooting Star
2 Candles Patterns:
- Engulf
- DarkCloud
- Piercing
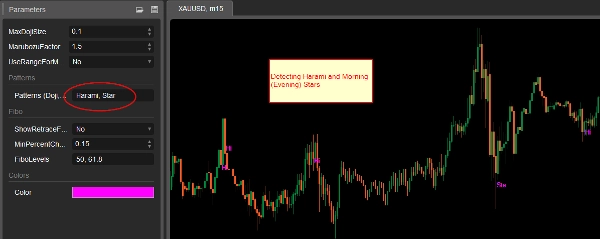
- Harami
3 Candles Patterns:
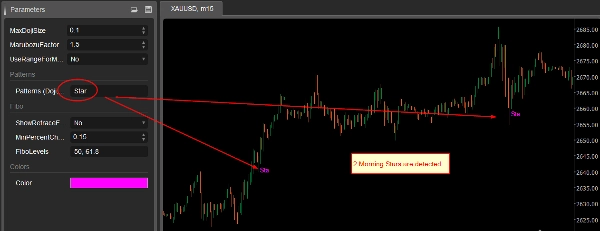
- Morning Stars
- Eveving Stars
Marubozu:
If selected, size of big body candles are annotated. Read the setting descriptions for size.
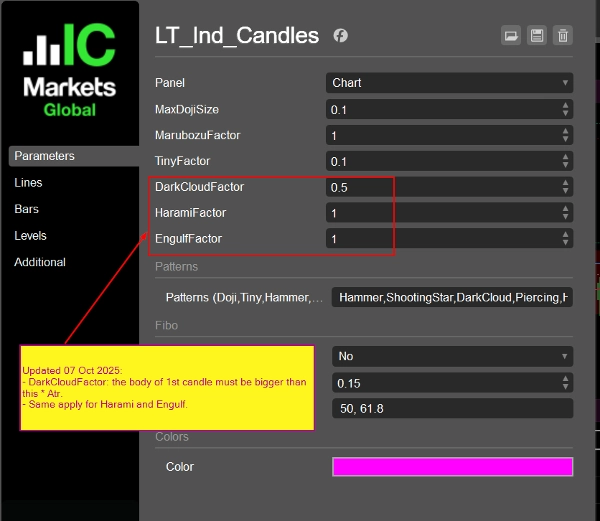
Settings:
(Updated 07 Oct 2025:
- Use Atr (14 periods, simple moving average) instead of MedianBarBody
- Added settings for DarkCloud (and Piercing), Harami, Engulf factors
)
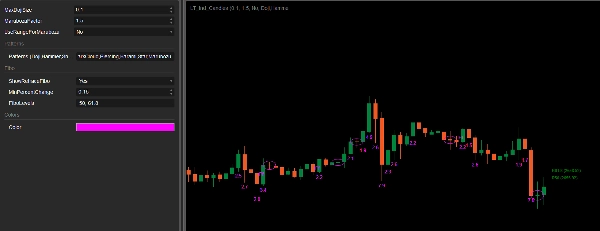
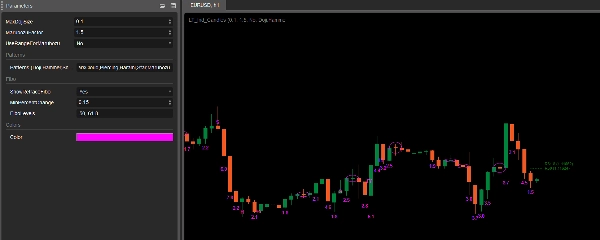
- MaxDojiSize: The maximum ratio between Bar Body over Bar Range to consider a Doji (default 0.1).
- Marubozu Factor: The BarBody of current bar must > MarubozuFactor * Atr to be considered a big candle (Marubozu). We do not care the wick here.
- Use Range For Marubozu: Use BarRange (High - Low) instead of BarBody (Open - Close).MathAbs() when check for Marubozu.
- Patterns: put patterns you want to detect, separated by comma. Accepted values are: Doji,Hammer,ShootingStar,Engulf,DarkCloud,Piercing,Harami,Star,Marubozu. Note that if choose "Star", both Morning Stars and Evening Stars will be detected.
- Show Retrace Fibo: A helper Fibo levels to help you control risk. When there are 2 consecutive Higher High and Higher Low candles, specified Fibo levels calculated from that 2 candles are plotted. You can hold your entry until price reach the levels to control risk. Levels are settable. The opposite side are same (Lower High and Lower Low).
- Min Percent Change: The 2 candles that used for Fibo levels must form a change in price > this percent.
- Fibo Levels: put your levels separated by comma.
- Color: color of the candle annotation.
Summary
Indicator profile
Customer reviews
4.0
Reviews: 1
5 | 0 % | |
4 | 100 % | |
3 | 0 % | |
2 | 0 % | |
1 | 0 % |
Discussion
FAQ
Forex
Signal
Indices
Commodities
Crypto
Stocks
ATR
Products available through cTrader Store, including trading bots, indicators and plugins, are provided by third-party developers and made available for informational and technical access purposes only. cTrader Store is not a broker and does not provide investment advice, personal recommendations or any guarantee of future performance.


Price
Since 25/09/2024
34
Sales