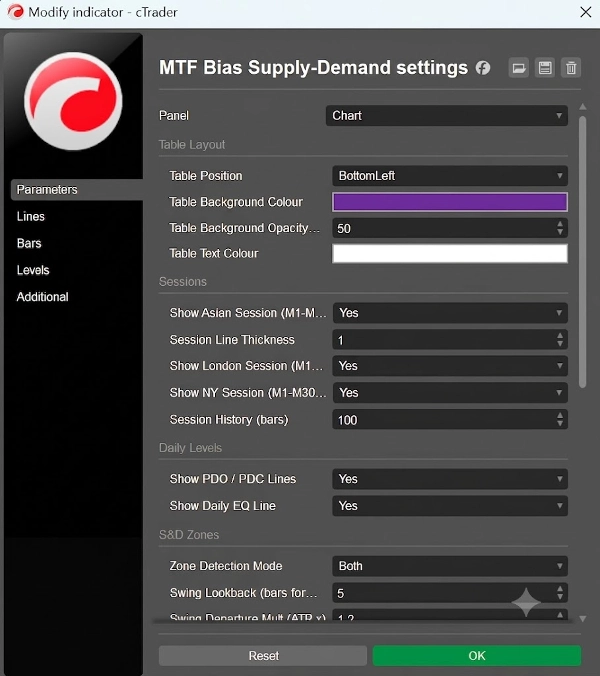

Description
This is a professional-grade multi-timeframe (MTF) market analysis tool designed for data visualisation on the cTrader platform. It automates the mapping of structural zones, multi-timeframe structural directional bias, session timing, and candlestick pattern identification to deliver objective, rules-based market analysis for assets such as Gold (XAU/USD), indices, or BTC.
1. Market Data & Conditions Analysed
The tool processes live tick and historical data across multiple layers to assess structural market conditions:
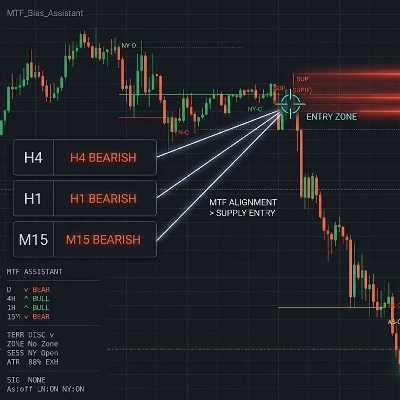
- Multi-Timeframe Directional Bias: Simultaneously evaluates price relative to structural levels across four distinct horizons: Daily, 4-Hour (H4), 1-Hour (H1), and 15-Minute (M15).
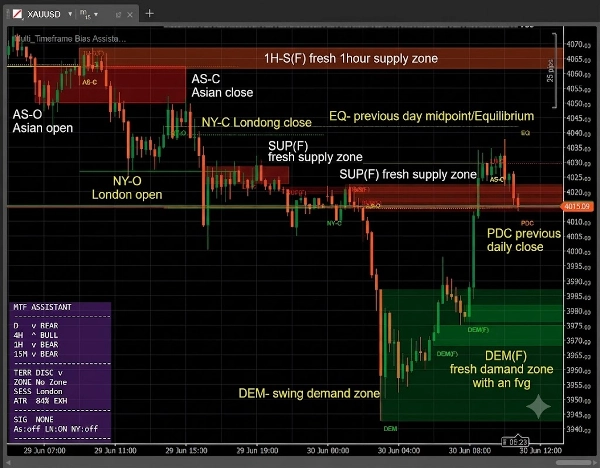
- Market Structure & Value: Identifies relative discount vs. premium pricing positions by calculating the current day's midpoint (Equilibrium - EQ). It scans for market structure shifts using Swing pivots and Impulse expansions.
- Imbalance Tracking: Identifies displacement by detecting the presence of Fair Value Gaps (FVG) attached to structural imbalances.
- Volatility Tracking: Monitors the current daily range against the 14-day Average True Range (ATR) to determine statistical overextension.
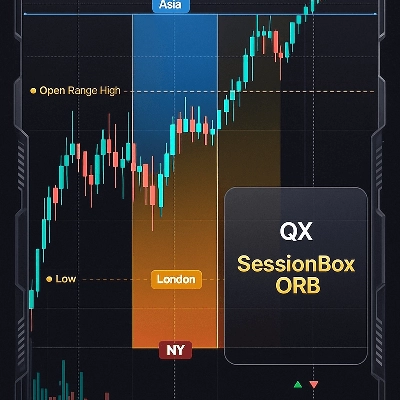
- Temporal Filters: Identifies core global trading sessions through precise UTC boundaries: Asian Open, London, and New York Open.
2. Visual Elements & Analytical Interpretation
On-chart visual elements map out structural areas where price has historically interacted:
- Structural Zones: Rendered as colored boxes. Standard demand zones feature a green fill with a green border; H1 demand zones display as blue/cyan. Standard supply zones feature a red fill; H1 supply zones display as orange.
- Daily Reference Lines: PDO (Previous Daily Open) displays as a solid white line; PDC (Previous Daily Close) displays as an orange line; Daily EQ (Equilibrium) displays as a yellow line tracking the 50% retracement level of the daily range.
- Session Open Markers: Colored horizontal lines mapping out session openings (Yellow for Asian, Red for London, Green for New York).
Confluence
- Confluence Dashboard: Displays a visual matrix on the dashboard when user-defined technical criteria align simultaneously. For example, a Bullish alignment state is highlighted when price interacts with a fresh demand zone below the Daily Equilibrium while higher-timeframe structures are aligned in a positive direction.
3. Key Settings & Parameters
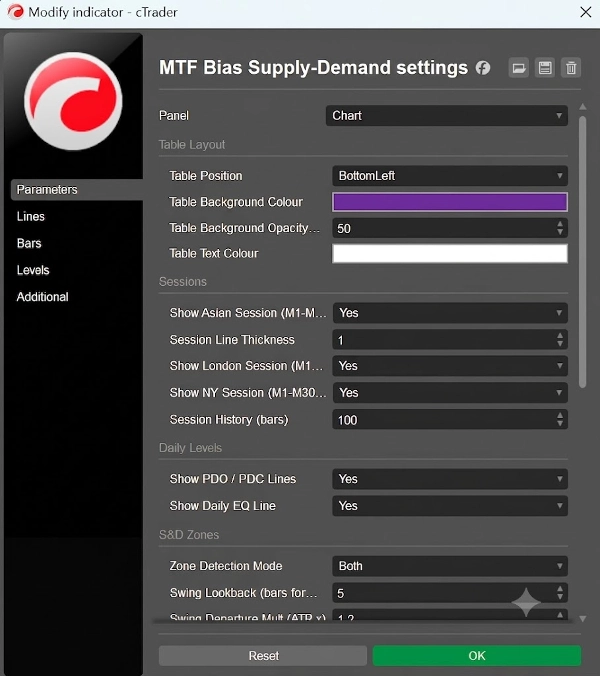
- Zone Detection Mode (SwingOnly, ImpulseOnly, or Both): Determines the mathematical logic used to define structural zones.
- Require FVG (True/False): When enabled, zones are only plotted if accompanied by a confirmed Fair Value Gap imbalance.
- Zone Retest Max: Defines how many times a zone can be tested before expiring from the chart. Setting this to 0 removes the zone immediately upon the first touch.
- Daily ATR Consumed % (AtrLimit): Default is 0.80 (80%). Provides a filtering mechanism if the asset has already moved beyond 80% of its average daily range, highlighting expansion exhaustion.
4. Technical Workflow Example
When monitoring a chart during market openings, the tool processes data to display concurrent technical factors. If the higher-timeframe matrix indicates a bullish structural alignment, and price subsequently moves below the Daily Equilibrium line into an H1 demand zone, the interface plots a PIN label and updates the dashboard status. This provides the user with an organised, visual summary of the pre-configured rulesets directly on the interface.
5. Target User Profile
- Experience Level: Intermediate to Advanced.
- Analytical Style: System-based analysis, multi-timeframe structural mapping, and session volume tracking.
- Strategic Compatibility: Designed for practitioners of systematic price action models, structural supply/demand frameworks, or multi-timeframe correlation models.
6. Limitations & Usage Notes
- Timeframe Visibility Matrix: Features a built-in visibility filter to maintain chart clarity. Lower-timeframe zones and micro-patterns are restricted to execution views (M1 through M15). Session lines automatically hide above the M30 view, and H1 zones hide above the H1 view.
- Fixed UTC Session Clocks: Session boundary tracking is mapped directly to fixed UTC hours (Asian: 00:00-07:00, London: 07:00-16:00, NY: 12:00-21:00). Settings may require manual adjustment if broker server times diverge from standard UTC.
- Automated Retest Pruning: With
ZoneRetestMax = 0, a minor liquidity wick will remove the zone definition from the display screen. Users should calibrate this setting based on their preference for immediate touches versus sustained mitigation blocks.
Summary
Visual elements include color-coded structural zones (demand and supply), daily reference lines (previous open, close, and equilibrium), and session open markers for Asian, London, and New York trading sessions. A confluence dashboard highlights when multiple technical criteria align, aiding systematic analysis.
Key configurable settings allow users to define zone detection logic, require Fair Value Gap confirmation, limit zone retests, and filter signals based on daily ATR consumption. The indicator supports intermediate to advanced traders employing systematic price action, supply/demand frameworks, or multi-timeframe correlation strategies. Timeframe visibility filters and fixed UTC session clocks help maintain chart clarity and session accuracy.