KANDIKA HEAT MAP
"KANDIKA HEAT MAP" logo
20/07/2025
1
Desktop
Since 08/06/2025
Sales
1
"KANDIKA HEAT MAP" uploaded image"KANDIKA HEAT MAP" uploaded image

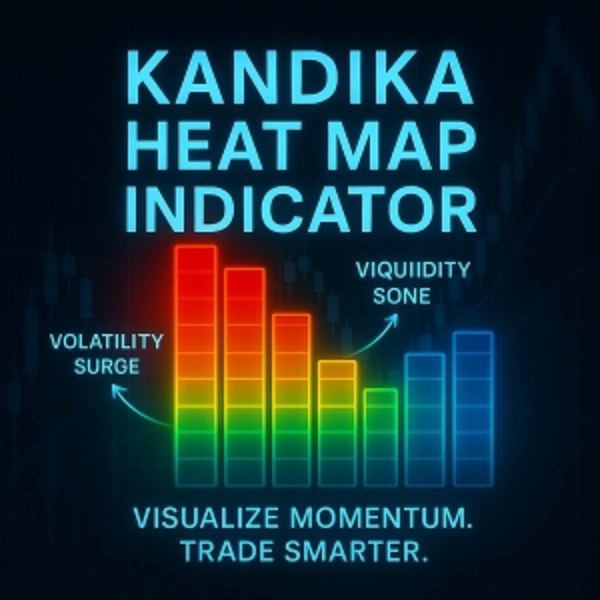
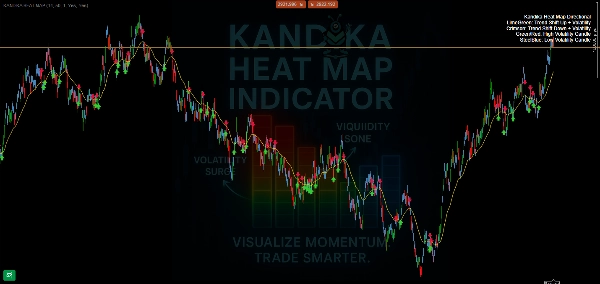
🎨 Color Logic – What It Tells You

  • 🟩 Lime GreenTrend Shift Up
    A bullish momentum change is forming. Use it to catch early upside.
  • 🟥 CrimsonTrend Shift Down
    Signals downside pressure building. Prepares you for potential shorts or exits.
  • 🟧/🔴 Orange/RedHigh Volatility Zone
    Expect price spikes, fast moves, and potential traps. Not a place to guess blindly—confirm your strategy.
  • 🟦 Steel BlueLow Volatility Zone
    Market is slowing, compressing, or ranging. Often sets up for breakout opportunities.


📊 What It Does (And Doesn’t Do)

  • Clearly maps out trend direction changes
  • Visually separates calm vs. volatile zones
  • Simple, chart-friendly overlay—no clutter
0.0
Reviews: 0
Customer reviews
No reviews for this product yet. Already tried it? Be the first to tell others!
You may also like
Indicator
NAS100
NZDUSD
Breakout
+18
Liquidity Sweep True Channel
Smart Liquidity Sweep detector with auto-drawing True Channels and real market structure mapping.
Open Trade PipsV1
This indicator tracks the unrealised amount of pips in your open positions.
Previous Day Liquidity Zones (PDH - PDL)
Useful indicator for traders who want to visualize key price levels based on previous daily highs and lows.
Indicator
Stocks
Forex
Crypto
+1
Market Structure SNR + Auto Bias
Market Structure Indicator – Your Trading Map in a Noisy Market. No more Panicking Which one, Where, Why and How.
EURUSD Breakout Indicator
Breakout Multi-Timeframe Strategy Indicator
Indicator
NAS100
NZDUSD
Breakout
+17
OHLC and SMC - Market Structure
Multi-TF OHLC, NY Midnight, ZigZag & Gann S/R—clean visuals for SMC, scalping, and intraday precision.
Indicator
Indices
Commodities
Stocks
+2
XY Bar Info Panel v1.5
Overlay panel showing bar date/time, OHLC, tick Volume, percent change, and market session - fully customizable.
Renko Wicks
Renko Wicks
Indicator
XAUUSD
Commodities
True Open Pivot Levels
This indicatorFull Description: Th shows the open price lines at key market times based on Eastern Standard Time (EST).
Indicator
NAS100
NZDUSD
XAUUSD
+14
Donchian Channel Pro
Tracks N-period highs/lows, HTF overlay, HUDs with ADX, RSI, session clocks. Customizable for precise trading.
Candle Timer & Strength Panel Demo -
Candle Timer & Strength Panel DEMO for cTrader DEMO VERSION – 24 hours free trial! This is a DEMO version of the Candle
Candle Timer & Strength Demo
Candle Timer & Strength DEMO for cTrader This is a DEMO version of the Candle Timer & Strength indicator. You can use al
Indicator
RSI
Breakout
XAUUSD
+5
Zones Supply Demand
📊Zones Supply & Demand: Identifies key price levels with high volume concentration, marking Supply/Demand Zones & Marke
Indicator
NAS100
NZDUSD
Breakout
+12
Samurai Breakout Pro II
⚔️Full breakout trading workstation: session box, EP/TP/SL levels, on-chart ✓/✗ outcomes, pro-level analytics and more⚔️
Indicator
NAS100
Indices
XAUUSD
+6
JacksonZones
Maps intraday and multiday structure using Fibonacci-projected session ranges.
Indicator
Indices
Prop
Stocks
+3
[Hamster-Coder] Price
Indicator designed to calculate and manipulate price inputs (sources) in real time
Indicator
Indices
AI
Machine Learning Momentum Index
The Machine Learning Momentum Index (MLMI) represents the next step in oscillator trading.
SmartFibonacci
SmartFibonacci — automatic Fibonacci retracements & extensions with swing detection, alerts and clean labels for cTrader