
Liquidity Cluster Order
Indicator
2 purchases
Version 1.0, Nov 2025
Windows, Mac
5.0
Reviews: 1
Description
Liquidity Cluster Order (LCO) 🔍💧
1. What LCO shows
Liquidity Cluster Order automatically detects and draws:
- Bullish liquidity clusters (potential demand / accumulation zones) ✅
- Bearish liquidity clusters (potential supply / distribution zones) 🔻
Each cluster is:
- anchored on a volume pivot bar (a local maximum of volume),
- classified as bullish or bearish based on the recent price extension,
- extended forward in time until price mitigates (consumes) the cluster.
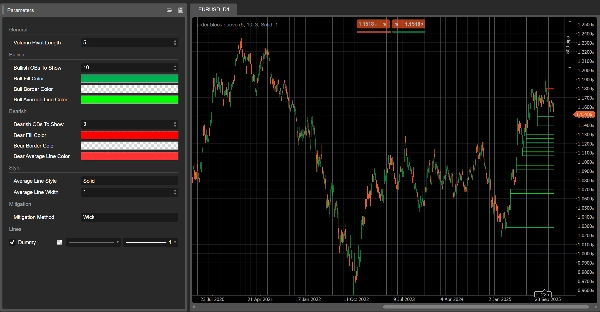
On the chart you see:
- Green rectangles → bullish liquidity clusters
- Red rectangles → bearish liquidity clusters
- A grey line inside each rectangle → the average price level of that cluster
Once a cluster is considered mitigated, it disappears from the chart and only active clusters remain.
2. Detection logic (in simple terms)
- Volume pivot
- LCO scans for bars where volume is higher than the previous and next
Volume Pivot Lengthbars. - These bars are volume pivots – potential anchors for liquidity clusters.
- LCO scans for bars where volume is higher than the previous and next
- Context: bullish vs bearish
- The recent price behaviour defines a context:
- Bullish context → downside extension has dominated.
- Bearish context → upside extension has dominated.
- This context decides whether the next volume pivot will create a bullish or bearish liquidity cluster.
- Bullish liquidity cluster
In a bullish context: - Cluster bottom = low of the pivot bar
- Cluster top = midpoint of the bar (
(high + low) / 2) - Interpretation: zone where downside pressure was absorbed and buyers stepped in aggressively.
- Bearish liquidity cluster
In a bearish context: - Cluster bottom = midpoint of the pivot bar
- Cluster top = high of the pivot bar
- Interpretation: zone where upside pressure was absorbed and sellers took control.
- Average line
- For each cluster, LCO computes the mean of top & bottom and draws a grey mid-line.
- This acts as an internal equilibrium level of the cluster.
- Mitigation (cluster consumption)
On every new bar, LCO checks if a cluster is mitigated: - For bullish clusters:
- It tracks a downside target price over the last
Volume Pivot Lengthbars: Mitigation Method = Wick→ lowest low.Mitigation Method = Close→ lowest close.
- If this target price goes below the cluster bottom, the bullish cluster is considered mitigated and removed.
- It tracks a downside target price over the last
- For bearish clusters:
- It tracks an upside target price:
Wick→ highest high.Close→ highest close.
- If this target price goes above the cluster top, the bearish cluster is mitigated and removed.
Mitigated = liquidity in that cluster is assumed consumed / invalidated.
3. How to read LCO on the chart
You’ll see mainly:
- Green clusters below price → potential demand liquidity zones
- Red clusters above price → potential supply liquidity zones
Typical reading (not trading advice):
- Fresh clusters
- Recently created clusters are often more relevant:
- Bullish cluster below price → area where buyers last absorbed sell pressure.
- Bearish cluster above price → area where sellers last absorbed buy pressure.
- Retests of a cluster
- Price returns to a bullish cluster from above:
- If price reacts and holds the bottom → possible bounce / long reaction zone.
- Price returns to a bearish cluster from below:
- If price fails to trade above the top → possible rejection / short reaction zone.
- Mitigated vs active clusters
- When price cuts through a cluster beyond its boundaries according to the chosen mitigation method,
→ that liquidity cluster is removed on subsequent bars. - Clusters still visible are active liquidity zones not yet fully traded through.
- When price cuts through a cluster beyond its boundaries according to the chosen mitigation method,
- Using the mid-line
- That grey mid-line can be used as:
- a profit-taking or partial exit level inside the cluster,
- a “fair price” reference within the liquidity zone,
- a quick way to see if price is trading in the upper or lower half of the cluster.
4. Parameters (English)
Volume Pivot Length
- Bars used to:
- detect volume pivots,
- compute extremes and mitigation target.
- Lower values → more clusters, more noise;
- Higher values → fewer, more significant clusters.
Bullish Liquidity Clusters To Show
(former Bullish OBs To Show)
- Maximum number of bullish clusters displayed on the chart.
Bearish Liquidity Clusters To Show
(former Bearish OBs To Show)
- Maximum number of bearish clusters displayed.
Bull Fill Color / Bear Fill Color
- Fill color of bullish/bearish clusters.
- You can include alpha (opacity) values.
Bull/Bear Average Line Color
- Color of the internal mid-line for each cluster.
Average Line Style
- Visual style for the mid-line:
"Solid","Dashed","Dotted".
Average Line Width
- Thickness of the mid-line.
Mitigation Method
"Wick"→ mitigation based on high/low wicks (more sensitive)."Close"→ mitigation based on closing prices (more conservative).
Summary
AI summary
Liquidity Cluster Order (LCO) is a trading indicator that automatically identifies and visualizes key liquidity zones on price charts. It detects bullish liquidity clusters (potential demand or accumulation zones) and bearish liquidity clusters (potential supply or distribution zones) by anchoring each cluster on volume pivot bars—local volume maxima—and classifies them based on recent price extensions.
On the chart, bullish clusters appear as green rectangles below the price, indicating areas where buyers absorbed selling pressure. Bearish clusters are shown as red rectangles above the price, marking zones where sellers absorbed buying pressure. Each cluster includes a grey mid-line representing the average price level, serving as an internal equilibrium reference.
Clusters extend forward in time until price "mitigates" or consumes them, at which point they disappear, leaving only active liquidity zones visible. Mitigation is determined by tracking price extremes (high/low wicks or closing prices) over a configurable number of bars.
Key parameters include the volume pivot length (defining sensitivity and cluster significance), maximum clusters displayed, cluster colors, mid-line style, and mitigation method. LCO supports various markets including forex, indices, commodities, stocks, and cryptocurrencies, and integrates with multiple trading strategies and indicators such as RSI, MACD, Bollinger Bands, and Fibonacci levels.
Indicator profile
Customer reviews
5.0
Reviews: 1
5 | 100 % | |
4 | 0 % | |
3 | 0 % | |
2 | 0 % | |
1 | 0 % |
Customer reviews
November 18, 2025
Two timeframes give more context. The first signal should not decide the only input.
Discussion
FAQ
Signal
Indices
Commodities
GBPUSD
RSI
Bollinger
Fibonacci
Scalping
AI
XAUUSD
NAS100
MACD
BTCUSD
Forex
Breakout
EURUSD
NZDUSD
Martingale
Prop
Supertrend
Fair Value Gap
SMC
Crypto
Grid
Stocks
ATR
USDJPY
VWAP
Products available through cTrader Store, including trading bots, indicators and plugins, are provided by third-party developers and made available for informational and technical access purposes only. cTrader Store is not a broker and does not provide investment advice, personal recommendations or any guarantee of future performance.


Price
42.11M
Traded volume
6.13M
Pips won
228
Sales
8.48K
Free installs