
Description
Marketplace Pitch (short)
Volume Delta & CVD — Read aggressive flow in real time. Flexible resets (Day/Week/Month), optional EMA smoothing, and non-repainting cumulative delta. Perfect for confirming breakouts and spotting divergences.
Volume Delta & CVD — Review & Parameter Guide
Tagline: Measure the buy/sell imbalance (Delta) and its cumulative flow (CVD) with flexible resets. Non-repainting.
Overview
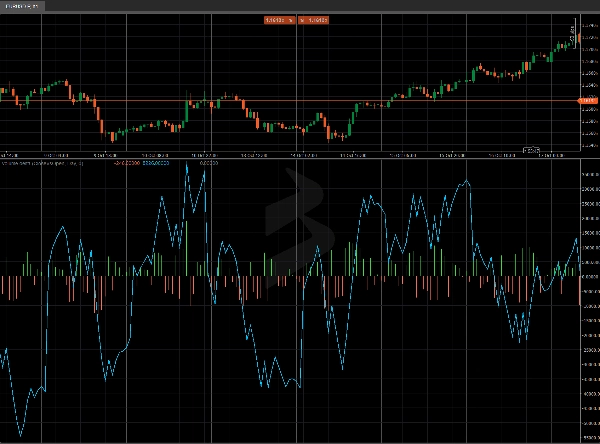
Volume Delta & CVD for cTrader computes, per bar, the Delta (aggressive buying vs selling) and the CVD (Cumulative Volume Delta). It helps you read order-flow pressure, confirm breakouts, and spot divergences against price.
Note: The indicator uses TickVolume (cTrader standard) as the volume proxy.
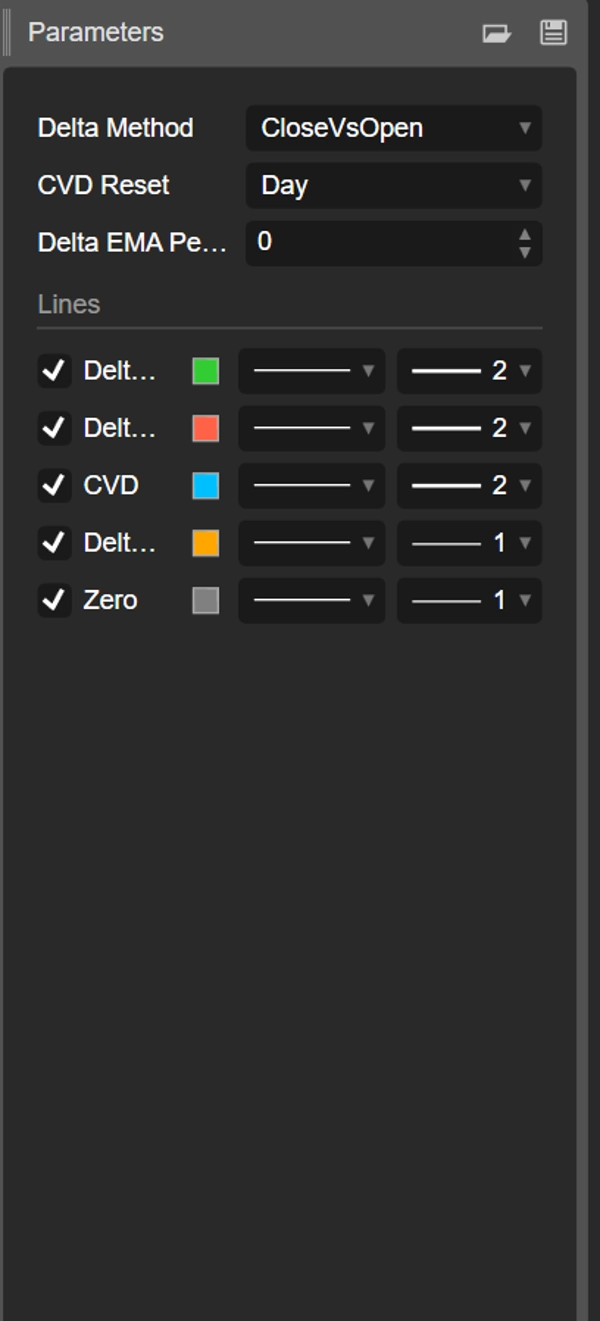
Parameters (detailed)
Delta Method
Choose how the bar’s directional flow is estimated:
- CloseVsPrevClose
Delta = ±TickVolume depending on Close[t] vs Close[t-1].
Pros: very responsive; great for intraday regime shifts. - CloseVsOpen
Delta = ±TickVolume depending on Close vs Open of the same bar.
Pros: highlights directional bars; reduces cross-bar noise. - Money Flow Multiplier (MFM)
MFM = ((Close−Low) − (High−Close)) / (High−Low)in [−1, +1]Delta = MFM × TickVolume
Pros: intra-bar weighting; smooth/robust when ranges are wide.
CVD Reset
Controls when the cumulative counter re-starts:
- None: continuous from chart start.
- Day: resets at each new day (intraday bias).
- Week: resets at each new week (swing).
- Month: resets at each new month (higher-timeframe bias).
Delta EMA Period (0 = off)
- Applies an EMA to Delta to smooth the histogram and reveal regime changes.
- Suggestions: 5–9 scalping, 10–21 intraday, 21–34 swing.
Outputs / Buffers
- Delta Up (green histogram): positive Delta portion.
- Delta Down (red histogram): negative Delta portion.
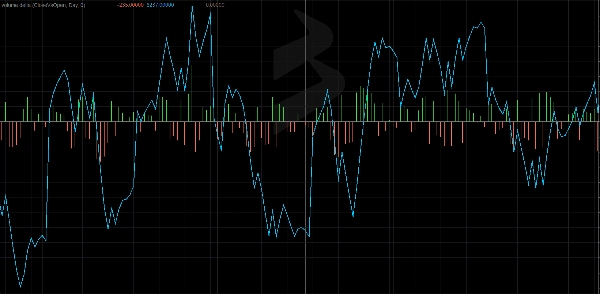
- CVD (aqua line): cumulative sum of Delta with the chosen reset.
- Delta EMA (orange line, optional): smoothed Delta.
- Zero (grey line): baseline for quick comparison.
How to Read It
- Delta > 0 → aggressive buying dominance in the bar.
- Delta < 0 → aggressive selling dominance in the bar.
- Rising CVD → accumulation; falling CVD → distribution.
- Divergences
- Price makes higher highs while CVD fails to confirm → potential buy-pressure exhaustion.
- Price makes lower lows while CVD fails to confirm → potential sell-pressure exhaustion.
Practical Playbooks
- Breakout confirmation: prefer long breakouts when CVD accelerates and Delta EMA flips positive.
- Fading extensions: look for price vs CVD divergences at key levels (VWAP/Anchored VWAP, S/R).
- Session bias: with CVD Reset = Day, read the dominant intraday direction.
Quick Start
- Attach the indicator.
- Start with Delta Method = MFM, CVD Reset = Day, EMA = 10 (intraday).
- On noisy charts, increase EMA or switch to CloseVsOpen.
- Seek confluence with Anchored VWAP, static/dynamic S/R, or price-action patterns.
Performance & Compatibility
- Modern APIs (
Bars.*,LineColor). - Non-repainting calculations.
- Works on any symbol and timeframe.
Summary
The indicator supports three Delta calculation methods: CloseVsPrevClose (responsive for intraday shifts), CloseVsOpen (reduces noise by focusing on directional bars), and Money Flow Multiplier (MFM) which weights intra-bar volume for smoother results. An optional Exponential Moving Average (EMA) smoothing can be applied to Delta to highlight regime changes.
Outputs include separate histograms for positive and negative Delta, the CVD line, an optional Delta EMA line, and a zero baseline for reference. Traders can use the indicator to confirm breakouts, identify divergences between price and volume flow, and assess order-flow pressure. It works on any symbol and timeframe, supporting markets such as Forex, indices, commodities, stocks, and cryptocurrencies.


