
Description
Pulse Radar: Professional Momentum & Cycle Dynamics Analysis
The Pulse Radar indicator is an advanced analytical suite for C#-driven platforms, engineered to decode market volatility and identify high-probability price development phases. Unlike lagging traditional indicators, Pulse Radar employs an adaptive evaluation of price equilibrium zones, providing a clear structural map of the market.
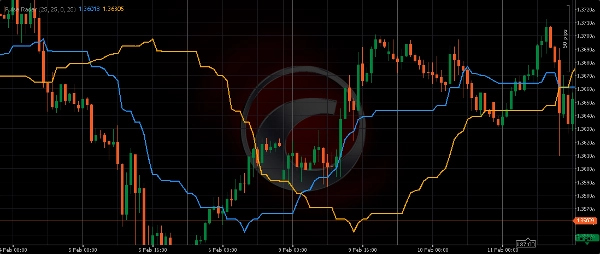
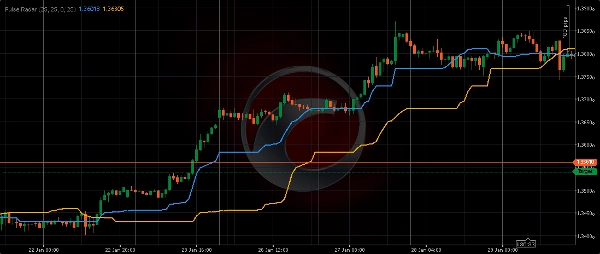
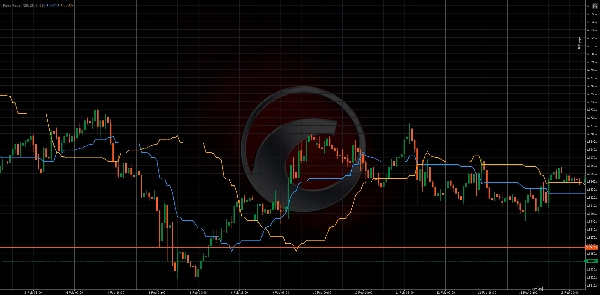
The system constructs two proprietary analytical curves:
- Active Vector (Fast): A high-responsiveness line reflecting immediate momentum and short-term liquidity shifts.
- Strategic Vector (Slow): A smoothed curve representing the dominant market cycle and institutional price balance.
By analyzing the price position relative to these curves, traders can accurately pinpoint the current market phase within a broader cyclical hierarchy. Pulse Radar also features advanced historical alignment, allowing for a direct comparison between current structural movements and past behavioral patterns.
Technical Methodology
- Extreme-Point Analysis: Lines are computed based on raw price extremes within specific look-back windows, eliminating the noise found in standard moving averages.
- Phase Synchronization: The algorithm supports manual and automatic offset adjustments to align data with historical chart segments.
- Structural Interaction: The convergence and divergence of the Active and Strategic vectors highlight transitions between trend accumulation and distribution phases.
Key Advantages
- Zero-Smoothing Precision: Calculations utilize raw market data, ensuring no artificial lag is introduced.
- Adaptive Framework: Fully configurable parameters to match any asset’s specific volatility profile.
- Cross-Market Utility: Optimized for High-Frequency Forex, US Equities, Commodities, and Crypto.
- High-Performance Architecture: Lightweight C# logic ensures zero impact on platform stability during high volatility.
Input Parameters
- Reach Period (Fast/Slow): Defines the depth of market data used for calculating the momentum vectors.
- Phase Shift (Fast/Slow): Allows for precise calibration of the analytical lines against historical price structures.
Summary
The indicator employs extreme-point analysis on raw price extremes within defined look-back periods, avoiding the lag and noise typical of standard moving averages. It supports manual and automatic phase shift adjustments to align current data with historical price patterns, enhancing structural interaction insights through the convergence and divergence of its vectors. Pulse Radar operates with zero smoothing, ensuring calculations are based on raw market data for precision without artificial lag.
Input parameters include Reach Period and Phase Shift for both fast and slow vectors, allowing customization to fit specific asset volatility profiles. Its lightweight C# architecture is optimized for high-frequency trading environments, maintaining platform stability during volatile conditions. Pulse Radar is applicable to a wide range of symbols such as BTCUSD, EURUSD, GBPUSD, XAUUSD, and indices like NAS100.
Customer reviews
5 | 100 % | |
4 | 0 % | |
3 | 0 % | |
2 | 0 % | |
1 | 0 % |


