
ORB_BRSTrading
Indicator
1 purchases
Version 1.0, Nov 2025
Windows, Mac
4.6
Reviews: 3
Description
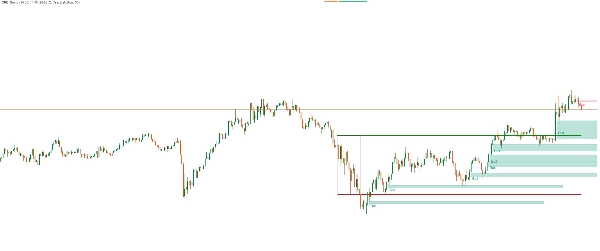
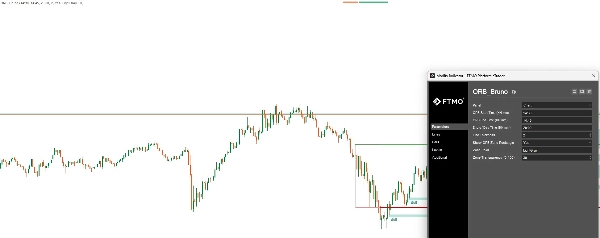
This indicator implements an Opening Range Breakout (ORB) trading strategy, designed to capture momentum during the most volatile period of the trading session. It identifies the opening range based on user-defined time parameters and plots breakout levels for potential entry signals. The strategy aims to exploit price movements when the market breaks above or below the initial range, often signaling strong directional trends.
Key Features:
- Customizable opening range time window
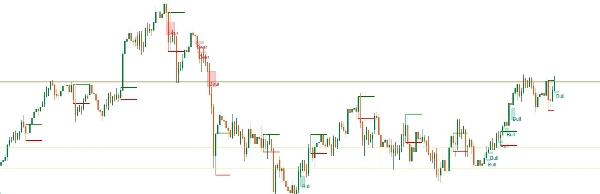
- Automatic calculation of breakout levels
- Visual alerts for breakout confirmation
- Works across multiple timeframes and instruments
- Ideal for intraday traders seeking high-probability setups
How It Works:
- Defines the opening range (high and low) for a specified time period.
- Monitors price action for breakouts beyond this range.
- Generates trade signals based on breakout direction and optional filters (e.g., volume, volatility).
Summary
AI summary
ORB_BRSTrading is an indicator implementing an Opening Range Breakout (ORB) trading strategy aimed at capturing momentum during the most volatile period of a trading session. It defines the opening range high and low based on user-specified time parameters and automatically calculates breakout levels. The indicator monitors price action for breakouts beyond this range and generates trade signals according to breakout direction, with optional filters such as volume or volatility. It provides visual alerts to confirm breakouts and supports multiple timeframes and instruments, making it suitable for intraday traders seeking high-probability setups. The strategy is applicable across various markets including Forex, stocks, indices, and symbols like BTCUSD, EURUSD, GBPUSD, XAUUSD, NAS100, and USDJPY.
Indicator profile
Customer reviews
4.6
Reviews: 3
5 | 67 % | |
4 | 33 % | |
3 | 0 % | |
2 | 0 % | |
1 | 0 % |
Customer reviews
February 9, 2026
ORB_BRSTrading is a solid Opening Range Breakout tool. Clean visuals and reliable logic make it work best on M10-H4. Great for intraday and session-based breakout strategies. Less effective on very low or very high timeframes.
December 10, 2025
December 2, 2025
Discussion
FAQ
BTCUSD
Forex
Breakout
Indices
EURUSD
GBPUSD
NZDUSD
Stocks
XAUUSD
NAS100
USDJPY
Products available through cTrader Store, including trading bots, indicators and plugins, are provided by third-party developers and made available for informational and technical access purposes only. cTrader Store is not a broker and does not provide investment advice, personal recommendations or any guarantee of future performance.
More from this author


!["[Stellar Strategies] Smart ADX" logo](https://cdn.ctrader.com/image/webp/af13b084-b6f6-41db-b7bc-c7e688b57b05_36929)


Price
Since 22/10/2025
303.42M
Traded volume
49
Pips won
1
Sales