present
Sign up and get $50 off your first purchase
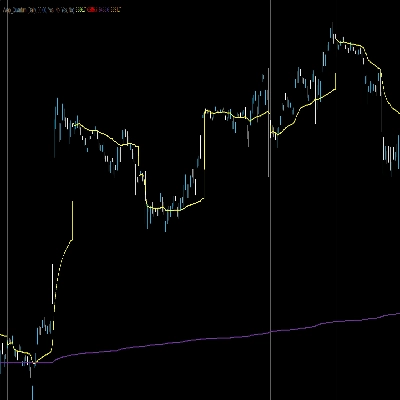
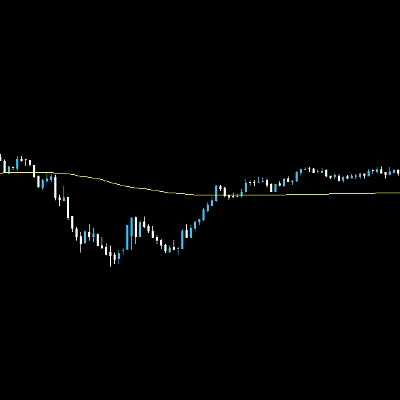
Trading product for Institutional Bubbles Indicator Volume Market Structure, image 1
Institutional Bubbles
Indicator
7 purchases
Version 1.0, Apr 2026
Windows, Mac
4.5
Reviews: 2
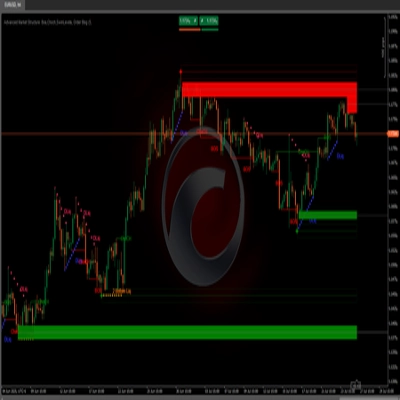
Trading product for Institutional Bubbles Indicator Volume Market Structure, image 2
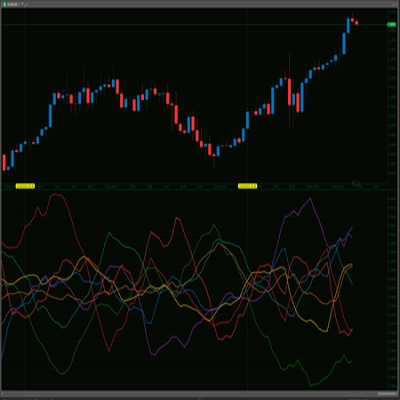
Trading product for Institutional Bubbles Indicator Volume Market Structure, image 3
Trading product for Institutional Bubbles Indicator Volume Market Structure, image 4
Trading product for Institutional Bubbles Indicator Volume Market Structure, image 5
Trading product for Institutional Bubbles Indicator Volume Market Structure, image 6
Since 24/03/2026
13
Sales
115
Free installs

Description

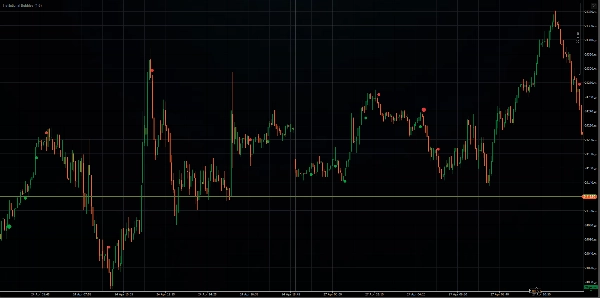
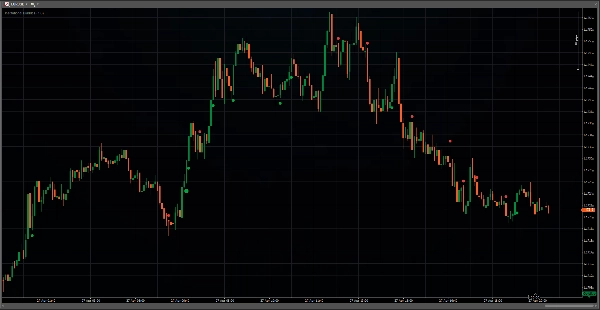
Institutional Bubbles focuses on detecting institutional participation.

__ Institutional activity varies with liquidity conditions and market context. To address this, the indicator applies a proprietary algorithm combining a lambda-based normalization with a rolling VWAP to isolate the obvious imbalance patterns. The objective is not to highlight and use the obvious suspicious signals, but to highlight and use the artificially "normal" and balanced activity. __

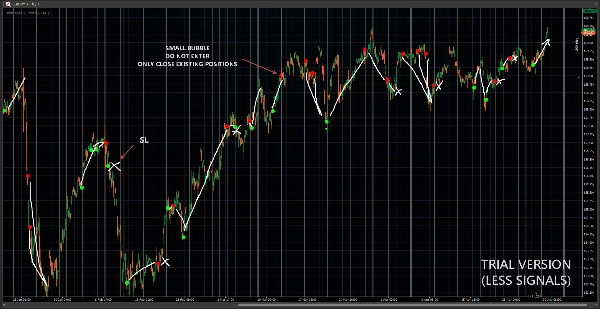
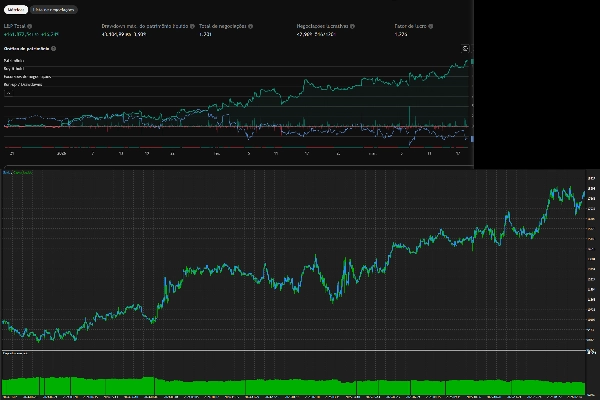
This is a fully quantified system. We backtested on others plataforms and that showed us that blindly following big-sized bubbles produces a consistent edge which was validated over 1000+ trades (the backtest follows the signal direction and close the position if a opposite side signal appears, no filters or others indicators was used). With a consistent edge over all symbols, this indicator is perfect to elevate your strategy to another level, giving you more confidence on entries.


* THE DEFAULT CONFIGURATION (SENSIBILITY=1.6 OR LOWER) IS THE BEST FOR EVERY SYMBOL.
* ALL SYMBOLS AND TIMEFRAMES ARE SUPPORTED, BUT IS RECOMMENDED TO USE M1 OR M5 FOR THE MOST PRECISE READING.

* WE DO NOT SELL AUTOMATIC TRADING ALGORITHMS.

Summary

AI summary
Institutional Bubbles is a trading indicator designed to detect and quantify institutional participation in the market by analyzing volume and price action patterns. It uses a proprietary algorithm that combines lambda-based normalization with a rolling Volume Weighted Average Price (VWAP) to isolate subtle, balanced trading activity rather than obvious imbalances. This approach aims to reveal hidden institutional trading signals that are typically "normal" in appearance but carry predictive value.

The indicator supports all symbols and timeframes, with a recommendation to use 1-minute or 5-minute charts for the most precise readings. Its default sensitivity setting (1.6 or lower) is optimized for broad applicability across markets. Institutional Bubbles provides fully quantified signals that have been backtested over 1000+ trades across multiple platforms, demonstrating a consistent edge when following the indicator’s directional signals without additional filters.

Key features include visualization of institutional activity, signal generation for breakouts, reversals, trend strength, volatility regimes, and support/resistance levels. It requires only bar data and is categorized under support and resistance indicators. This tool is intended to enhance trading strategies by offering insights into hidden market dynamics driven by large participants.
Indicator profile
Indicator category
Support & resistance
Output type
Visualisation
Signals
Filter
Data requirements
Bars only
Supported signals
Breakout
Reversal
Trend strength
Volatility
Level break
Level touch

Customer reviews

4.5
Reviews: 2
5
50 %
4
50 %
3
0 %
2
0 %
1
0 %
Customer reviews
May 4, 2026

Discussion

FAQ

Volume
Market Structure
Supply & Demand
VWAP
Support & Resistance
Products available through cTrader Store, including trading bots, indicators and plugins, are provided by third-party developers and made available for informational and technical access purposes only. cTrader Store is not a broker and does not provide investment advice, personal recommendations or any guarantee of future performance.

More from this author

Indicator
OBV
Volume
+2
Weis Wave indicator based on the original work of David Weis.
Indicator
Volume
Order Block
+4
Volume Profile with fixed period, custom range and buy/sell pressure.
Indicator
SMC
Prop
+5
VA Footprint replaces your chart with a order flow one, the most precise way to read the market.
Indicator
VWAP
Volume
+3
Don't trust static support and resistance levels, this indicator combines Fibonacci and VWAP in one powerful tool.

You may also like

Indicator
MACD
Prop
+14
Enhance MACD Histogram! Visualize bull and bear price changes with vibrant colors for clearer, more insightful trading.
Indicator
VWAP
Forex
+13
Custom VWAP Indicator for cTrader
Indicator
Forex
BTCUSD
+9
This indicator implements an Opening Range Breakout (ORB) trading strategy, designed to capture momentum during the most
Indicator
AI
RSI
+7
Multi-asset screener with real-time RSI/volatility analysis, interactive dashboard, and color-coded trading signals.
Indicator
Advanced price action tool that combines multiple technical analysis concepts
Indicator
MSS
Volume
+3
Rejection-based volume profile with tiered heat zones, POC levels and a fully draggable anchor on cTrader.
Indicator
Forex
NZDUSD
+2
RCS: 8 majors! AUD,USD,EUR,JPY,GBP,CAD,CHF,NZD. Find how strong each currency is relatively and trade smarter!
Indicator
ADX
ATR
+2
GOLD SENTINEL v1.0 - A CANDLE-COLORING INDICATOR FOR GOLD.
Indicator
Forex
Customizable multi-timeframe pivot point indicator for cTrader with alerts, Fibonacci, CPR, and more!
Indicator
Drawdown Monitor
Protect your funded account. Real-time Daily Equity Drawdown monitor with Green / Orange / Red flashing alerts.
"vwap" logo
Popular
4.8
(5)
$26
Indicator
VWAP
Forex
+2
Custom VWAP Indicator for cTrader
Indicator
Forex
BTCUSD
+7
🚀 TMAX RBA Indicator - The Ultimate Multi-Timeframe Momentum System 🚀
Indicator
AI
SMC
+9
Identifies market trends (-10 to +10) using HMA with volume confirmation. Includes customizable alerts.
Indicator
Forex
EURUSD
+4
Check the correlations between dozens of assets in one elegant display.
Indicator
VWAP
NAS100
+5
Key NY session opens for NASDAQ (US100) & SP500 to find Tick Precise Entrys for High R:R intraday setups.
Indicator
Prop
Forex
+4
The Smooth Heiken Ashi indicator is a refined charting tool designed to filter out market noise and highlight true price
Indicator
RSI
RSI on the main chart with 45/55 momentum levels, overbought/oversold levels, averaged RSI, and multi-timeframe support.
Indicator
AI
SMC
+5
Coloring trendline/ Colored Trendline / Color Trendline

Price

Since 24/03/2026
13
Sales
115
Free installs