
Weis Waves
Indicateur
57 téléchargements
Version 1.0, May 2026
Windows, Mac
Description
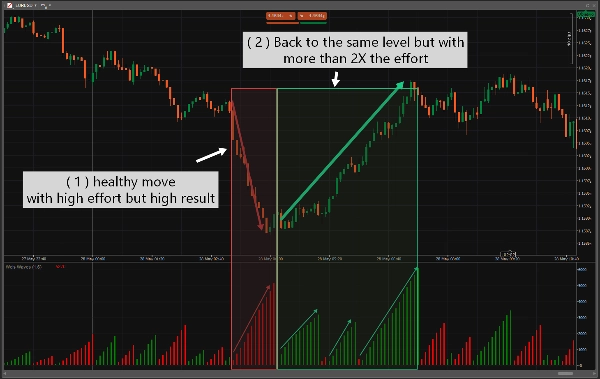
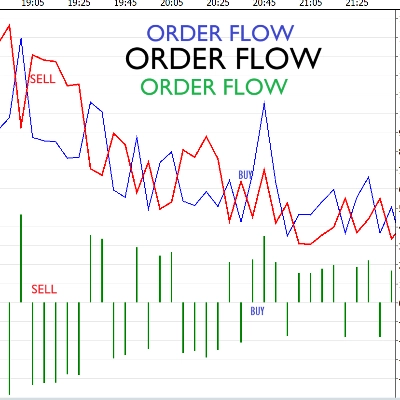
L'indicateur Weis Wave est basé sur le travail de David Weis, un technicien qui a combiné l'analyse Wyckoff avec le chartisme moderne. Il utilisait ces vagues de volume pour repérer quand l'argent intelligent participe activement ou se retire, suivant le principe de Wyckoff selon lequel le volume valide le mouvement des prix.
Quand l'utiliser :
[ Confirmation de tendance ]
[ Epuisement du momentum ]
[ Divergence ][ Absorption]
Résumé
Résumé IA
The Weis Waves indicator is based on the original work of David Weis, who integrated Wyckoff analysis with modern charting techniques. It analyzes volume waves to identify when informed market participants ("smart money") are actively involved or withdrawing, following the Wyckoff principle that volume confirms price movements. This indicator is used primarily for trend confirmation, detecting momentum exhaustion, spotting divergences, and identifying absorption phases in the market. It processes bar data with volume information and provides visualizations, filters, and trading signals related to trend strength, reversals, and divergences. The indicator is categorized under volume-based tools and supports analysis of supply and demand zones, imbalances, and on-balance volume concepts.
Profil de l'indicateur
Catégorie de l'indicateur
Volume
Type de résultat
Visualisation
Filtre
Signaux
Exigences en matière de données
Barres seulement
Volume
Signaux pris en charge
Inversion
Puissance de la tendance
Divergence
Avis clients
0.0
Avis : 0
Avis clients
Il n'y a pas encore d'avis sur ce produit. Vous l'avez déjà essayé ? Soyez le premier à en parler aux autres !
Discussion
Questions fréquentes
Imbalance
OBV
Volume
Supply & Demand
Les produits disponibles sur cTrader Store, notamment les bots de trading, les indicateurs et les plug-ins, sont fournis par des développeurs tiers et mis à disposition à titre informatif et à des fins d'accès technique uniquement. cTrader Store n'est pas un courtier et ne fournit aucun conseil en investissement, aucune recommandation personnelle ni aucune garantie quant aux performances futures.


Prix
Depuis le 24/03/2026
10
Ventes
57
Installations gratuites