Indicator
RSI
Breakout
Supertrend
Trend Heikin Multi MA
"Trend Heikin Multi MA" logo
03/09/2025
4
Desktop
Sinceย 03/10/2024
Sales
105
Free installs
16347
"Trend Heikin Multi MA" uploaded image"Trend Heikin Multi MA" uploaded image"Trend Heikin Multi MA" uploaded image"Trend Heikin Multi MA" uploaded image"Trend Heikin Multi MA" uploaded image"Trend Heikin Multi MA" uploaded image"Trend Heikin Multi MA" uploaded image"Trend Heikin Multi MA" uploaded image

๐Ÿ“Š TrendHeikinMultiMA โ€“ Advanced Trend Algorithm

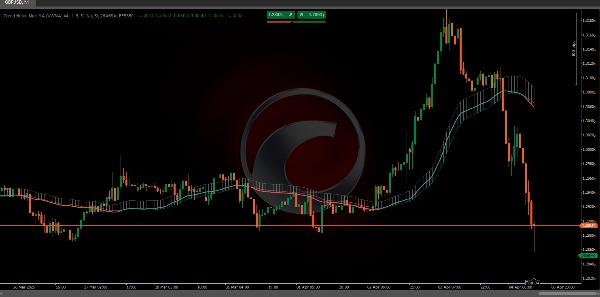
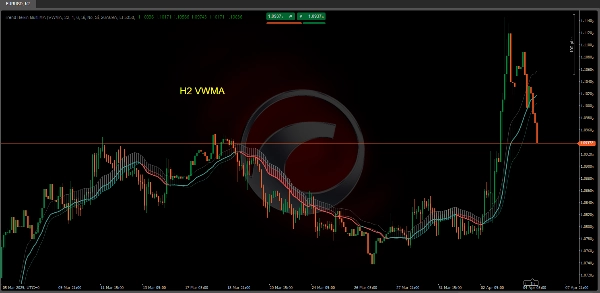
The TrendHeikinMultiMA algorithm is designed to calculate trend values from price data, using the Heikin-Ashi formula to smooth these values and applying different types of moving averages (ALMA, HMA, SMA, SWMA, VWMA, WMA, ZLEMA, or EMA).

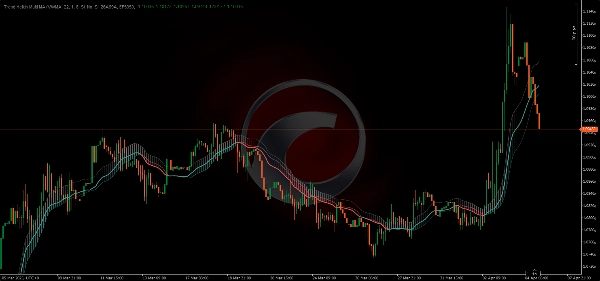
Although Heikin-Ashi values are used internally, the chart does not display traditional Heikin-Ashi candles. Instead, it draws trend lines based on the smoothed values, making market direction easier to interpret without the visual complexity of candlestick charts.


๐Ÿ”„ 1. The Role of Smoothing

Since the trend values are derived from Heikin-Ashi smoothing combined with a moving average, the color change in TrendHeikinMultiMA does not happen immediately when the price crosses the trend line:

  • ๐Ÿ”น The price may temporarily move above or below the trend line without triggering a color change.
  • ๐Ÿ”น This happens because the indicator waits for a significant and sustained difference between the smoothed open and close values to confirm an actual trend reversal.

โœ… Advantage in Interpretation

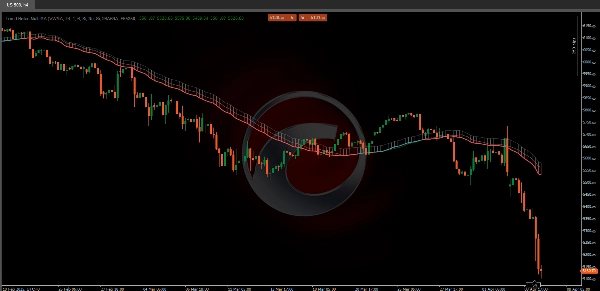
This intentional delay in the color change helps avoid false signals. In a traditional candlestick chart, the price might briefly cross the trend line and trigger premature signals.

  • ๐ŸŸฅ For example, even if the current price is above a bearish trend line, the indicator will remain red (bearish) until the smoothed values confirm that the close is consistently higher than the open.
  • ๐ŸŸฉ Similarly, to switch to green (bullish), the Heikin-Ashi-based moving average must confirm that the close consistently exceeds the open.


๐Ÿ“ˆ 2. Applying Moving Averages to Heikin-Ashi Values
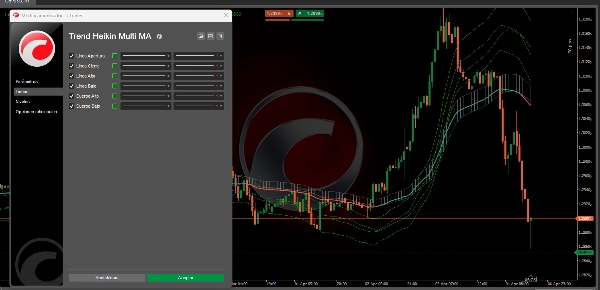
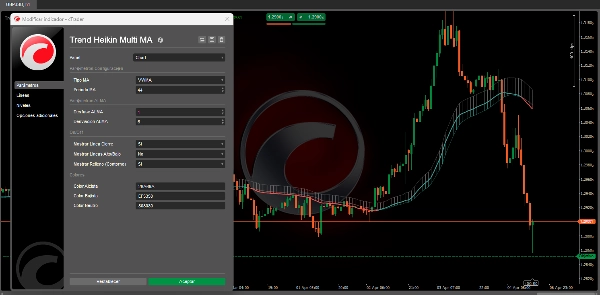
  • ๐Ÿ”„ Moving Average Selection:
    • The user can choose between different moving average types (ALMA, HMA, SMA, SWMA, VWMA, WMA, ZLEMA, and EMA).
    • Each MA type applies a specific mathematical method to weight and smooth the historical values of the open, close, high, and low derived from Heikin-Ashi.


๐Ÿ† 3. Advantages of Using TrendHeikinMultiMA vs. Traditional Candlesticks
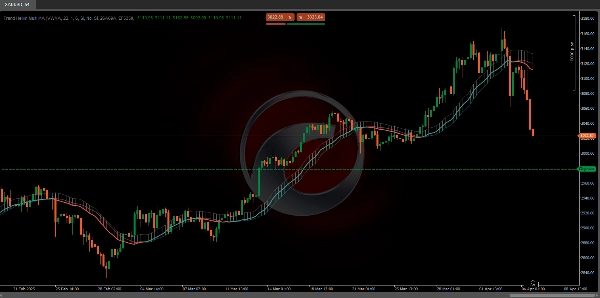
  • ๐Ÿ“‰ Noise Reduction:
    • Traditional candlesticks often display high volatility and scattered data, making it harder to identify the overall trend.
    • TrendHeikinMultiMA smooths out this data, filtering out minor fluctuations and eliminating abrupt swings, allowing traders to focus on the primary market direction.


โœ… Conclusion

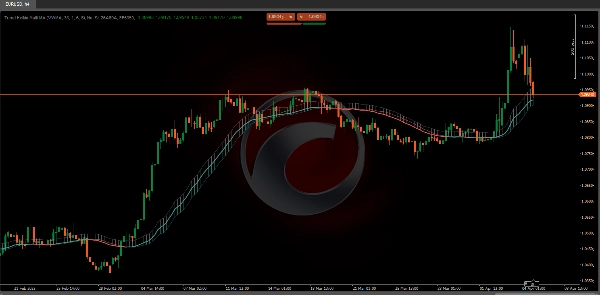
In summary, TrendHeikinMultiMA confirms a trend change (bullish or bearish) only when the smoothed open and close valuesโ€”calculated from Heikin-Ashi and processed through the selected moving averageโ€”consistently show that the market behavior has reversed its direction.

This ensures that signals are more reliable and less affected by the noise seen in traditional candlestick charts. ๐Ÿš€๐Ÿ“Š


๐Ÿ”ฅ  Pinescritlabs Ctrader Store indicators  ๐Ÿ”ฅ

Fair Value Gap Sessions

ZigZag

 BOS & CHOCH

Channel Breakout System

Supertrend

Market Imbalance

Adaptive Trend Channel 

Dynamic Market Structure
Analysis of Turning Points

Order Block

Fibonacci Linear
Regression Multi-timeframe

Volume POC Heatmap

Dynamic RSI

Momentum Fair Value Gap

Market Flow Projection

Dynamic Trend Gradient

Multi-Level Candle Bias
Tracker

Zig-Zag Extremity Tracker

Reactive Moving Average

Auto-Trend Channel

Auto Support and
Resistance Trend Lines

All Support and
Resistance Levels

Leverage Liquidation Map

Zones Supply Demand

Dynamic Range Momentum


0.0
Reviews: 0
Customer reviews
No reviews for this product yet. Already tried it? Be the first to tell others!
More from this author
Indicator
RSI
Breakout
XAUUSD
+6
ZigZag
ZigZag filters noise, spots trends, patterns, pivots, aiding analysis, trade management, and confirmations. ๐Ÿ“‰๐Ÿ“ˆ
Indicator
RSI
Breakout
XAUUSD
+6
Order Block
Identify bullish and bearish Order Blocks to spot key support/resistance levels and potential trend reversals! ๐Ÿ“ˆ๐Ÿ”„
Indicator
RSI
Breakout
XAUUSD
+5
Auto-Trend Channel
Adaptive trend channel using linear regression and Pearson correlation for dynamic support, resistance, and trends.
Indicator
RSI
XAUUSD
Breakout
+5
BOS & CHOCH
Market structural patterns , specifically the concepts of Change of Character (ChoCH) ๐Ÿ”„ and Break of Structure (BoS) ๐Ÿ’ฅ
Indicator
RSI
Breakout
XAUUSD
+5
Zones Supply Demand
๐Ÿ“ŠZones Supply & Demand: Identifies key price levels with high volume concentration, marking Supply/Demand Zones & Marke
Indicator
RSI
Breakout
Supertrend
All Support and Resistance Levels
"Identify key market zones and visualize support/resistance from multiple timeframes on a single chart.
Indicator
RSI
Breakout
XAUUSD
+6
Volume POC Heatmap
๐Ÿ“Š Shows volume by price levels, highlights POC, and key zones. Identifies dynamic support/resistance and imbalances.
Indicator
RSI
Breakout
XAUUSD
+5
Supertrend
๐Ÿ’น Define a price channel ๐Ÿ“ˆ and determine trend direction (bullish ๐ŸŸข or bearish ๐Ÿ”ด).
Indicator
RSI
Breakout
XAUUSD
+6
Fair Value Gap Sessions
identify and highlight temporary market inefficiencies known as "fair value gaps" ๐Ÿšจ within specific trading Sessions.
Indicator
RSI
Breakout
XAUUSD
+4
Dynamic Market Structure Analysis of Turning Points
Identify market structure effortlessly with swing highs, lows, CHoCH, and BOS levels for smart trading decisions! ๐Ÿ“Š๐Ÿ”"
Indicator
Indices
RSI
XAUUSD
+7
RSI Divergence
Detects bullish and bearish divergences
Indicator
RSI
Breakout
Supertrend
Leverage Liquidation Map
๐Ÿ“Š Liquidation Map: Potential areas where highly leveraged investors might face liquidations.
Indicator
RSI
Breakout
XAUUSD
+4
Multi-Level Candle Bias Tracker
Price direction by calculating the probability of reaching new highs/lows. Shows levels & stats๐Ÿ“ˆ
Advanced Market Structure Bos,Choch,SwinLevels, Order Blog
Advanced price action toolย that combines multiple technical analysis concepts
Indicator
RSI
Breakout
Supertrend
Market Trend OB
Price action to detect when the market changes trend (MSB) and defines, order blocks , ZigZag etc.๐Ÿ“Š
Indicator
RSI
Breakout
Supertrend
Zig-Zag Extremity Tracker
Dynamically adjusts regression channels based on ZigZag extremes, resetting when price breaks bands to track real trends
Indicator
RSI
Breakout
Supertrend
+3
Fibonacci Linear Regression Multi-timeframe
Combining Fibonacci levels and regression to analyze multidimensional market trends across multiple timeframesยก
Indicator
RSI
Breakout
Supertrend
+1
Momentum Fair Value Gap
It identifies areas of market imbalance (Fair Value Gaps or FVGs) and projects them on the chart in a smart way
You may also like
Indicator
Breakout
BreakOut_Probability_Expo
Break Out Probability Experimental indicator. Credits for this indicator goes to Zeiierman !!!
Fury Team E_M_A_su_TF
EMA ON TF (MULTI-TIMEFRAME)
50 percent
This indicater is a magical impact which shows exactly high and low with 100% results
Commodity Channel Index Smoothed w Alerts_NSC
Smoothed CCI alerts! Audio & arrow signals for +/-100 crosses. Custom sounds & arrow filters. Precision trading!
Indicator
RSI
Indices
StochasticRSI
Stochastic RSI (StochRSI) is a technical indicator used to measure the strength and weakness of the RSI.
Indicator
NAS100
NZDUSD
XAUUSD
+12
Initial Balance Breakout Signals
๐Ÿ“ˆ Initial Balance Breakout Signals: visually accurate IB levels, breakout alerts & forecast zones for smart trading.
Indicator
Indices
RSI
ATR
AlgoCorner Crosshair Edge
Pinpoint, highlight and lock market data easily
E7 Harmonic Structures Basic
E7 Harmonic Structures Basic.
Indicator
Indices
Commodities
Stocks
+2
SymbolTFOverlay
The SymbolTFOverlay display the current symbol and timeframe as a semi-transparent text overlay on the chart.
Top-rated
Free
VWAP Pro
Advanced VWAP with up to 30 anchored levels, multiple timeframes, memory mode, standard deviation bands & simple GUI
Indicator
VWAP
Indices
Forex
TPO Profile v2.0
TPO Profile v2.0
Indicator
Scalping
ACTO-v1
ACTO: Oscillator tracking average candle duration to anticipate volatility shifts in trading.
Indicator
Breakout
ORB v1.1
Opening Range Breakout v1.1 - Visuals + Stats
Weekly Daily Levels
The Weekly Daily Levels indicator shows the OHLC, and mid-point prices for the previous day and week.
Price Speed or Acceleration v1
This Indicator will display either the speed or the acceleration of the current symbol.
HMA MTF 2.0
HMA MTF 2.0 (Multi-Timeframe )
Indicator
NAS100
Indices
Breakout
+6
All-in-One Session Levels Suite
Institutional Session Levels Pro OHLC,Prev(D,W,M OHLC)
Indicator
Breakout
3 Bar Triangle by Linda Raschke
3 bar triangle = high below 2 day high, low above 2 day low