

Description
Pinescriptlabs Store indicators: Pinescriptlabs Store cBots : (cBot) Gold & BTC BreakoutSession Pivots(new)
Advanced Market Structure: Bos, Choch, SwinLevels, Order Blocks, Market Structure & Liquidity Finder (New)
ZigZag Price Liquidity Projection
Trailing Smart Algorithm (new)
Prediction Based on Linreg & ATR
SmartTrend Support &
Resistance
Lines
Dynamic
Market Structure
Analysis
of
Turning
Points
Fibonacci
Linear
Regression
Multi-timeframe
Auto
Support and
Resistance
Trend
Lines
All
Support and
Resistance
Levels
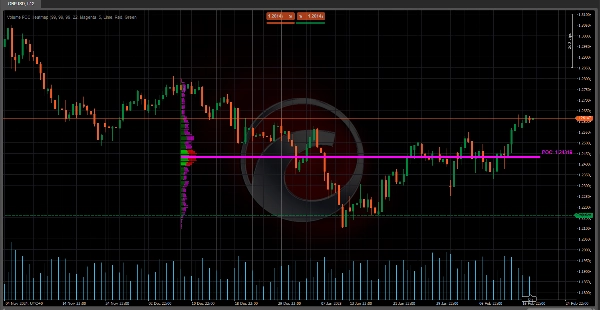
🔥 Volume POC Heatmap 🔥
This indicator is a Volume Profile that displays the distribution of traded volume across different price levels during a specific period. Its main goal is to identify key support/resistance zones and areas where the market has shown the most interest (high buying/selling activity). It’s super useful for:
- Detecting the Point of Control (POC) 🎯
The price level with the highest volume, acting as a magnet for price action. - Visualizing the Value Area (VA)
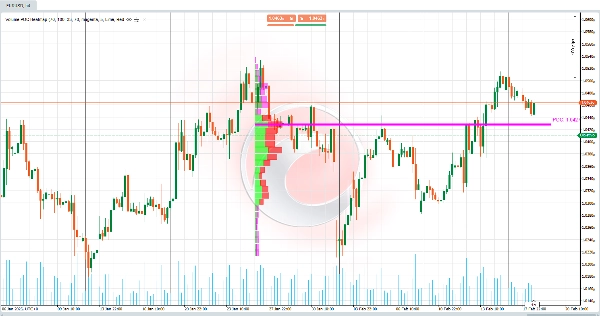
The zone where a specific percentage of total volume is concentrated (e.g., 70%), indicating balance between buyers and sellers. - Differentiating Bullish and Bearish Volume 📈📉
Shows where buying power vs. selling pressure accumulates.
🧠 Key Logic & Calculations 🔢
- Price Range Division 📏
- The price range (from the lowest to the highest in the last B Bars ) is divided into Volume Cells (CNum) .
Example: If CNum = 33 , the range is split into 33 equidistant levels.
- The price range (from the lowest to the highest in the last B Bars ) is divided into Volume Cells (CNum) .
- Volume Distribution by Level 📊
- For each bar in the historical data:
- The volume associated with the body (difference between open and close) and wicks (highs and lows) is calculated.
- The volume is proportionally distributed across the price cells intersected by the bar.
Example: If a green (bullish) bar covers 3 cells, the volume is assigned mainly to those cells as "bullish volume."
- Point of Control (POC) Calculation 🎯
- The POC is the cell with the highest accumulated volume, representing the price where there was the most consensus between buyers and sellers.
- Value Area (VA) Calculation 🔄
- Expands from the POC upwards/downwards until it encompasses the specified % of total volume (e.g., 70%).
Example: If the VA ranges from 100 to 105 , it means 70% of the volume was traded within that range.
- Expands from the POC upwards/downwards until it encompasses the specified % of total volume (e.g., 70%).
- Visual Normalization 🖼️
- Volumes are scaled using a Scale Factor to adjust the width of the bars on the chart, making visualization easier.
🛠️ Key of the Volume POC Heatmap 💡
- Lack of Context in Traditional Volume Indicators 🤔
Classic volume indicators (like bar-by-bar volume) don’t show where the volume was traded. This indicator maps volume by price level, solving that issue. - Organic Support/Resistance Identification 🚀
Zones with high volume act as dynamic support/resistance, more reliable than static lines. - Detection of Imbalances ⚖️
Areas with predominantly bullish or bearish volume signal potential breakouts or reversals.
💡 Practical Use in Trading 📈
- POC as a Zone of Interest 🎯
- If the price approaches the POC, expect reactions like bounces or consolidations.
- Value Area (VA) as a Balance Zone 🔄
- If the price is outside the VA, it tends to return to it (magnetic effect).
- If the price is inside the VA, it may indicate consolidation.
- Bullish/Bearish Volume as Confirmation 🔍
- A spike in bullish volume at resistance suggests a potential breakout.
- High bearish volume at support indicates a possible breakdown.
🌟 Example 📊
Parameters Used (Visible & Configurable by the User):
- Bars Back = 55 → Number of historical bars analyzed.
- Volume Cells = 33 → Number of divisions/cells in the price range.
- Value Area Volume % = 70 → Percentage of volume defining the Value Area.
Situation:
- The price breaks through a technical support level, but the volume in that zone is low (according to the profile).
- Later, the price returns to the Value Area (VA) defined by 70% of the total volume.
Interpretation:
- The breakout was false (due to low volume in the breakout zone).
- The market seeks to rebalance within the Value Area , where there’s higher activity (high volume density).
Action:
- Look for buying opportunities near the lower limit of the VA or the POC, as these are zones of high interest for market participants.
Summary
Key functionalities include:
- Division of the price range into multiple volume cells for detailed volume mapping.
- Calculation of POC as the volume consensus price.
- Determination of the Value Area around the POC.
- Visual normalization of volume bars for clearer chart representation.
This tool addresses the limitation of traditional volume indicators by showing where volume was traded rather than just total volume per bar. It helps identify dynamic support and resistance zones based on volume concentration and detects volume imbalances that may signal potential breakouts or reversals. Traders can use it to anticipate price reactions near the POC and VA, aiding in decision-making for entries and exits. Configurable parameters include the number of historical bars analyzed, volume cells, and the percentage defining the Value Area.
Customer reviews
5 | 100 % | |
4 | 0 % | |
3 | 0 % | |
2 | 0 % | |
1 | 0 % |


