Description
Pinescriptlabs Store indicators: 🤖Pinescriptlabs Store cBots :
ICT Power of 3 (cBot) Gold & BTC BreakoutSession Pivots(new)YieldShield"
SmartTrend Support &
Resistance Lines
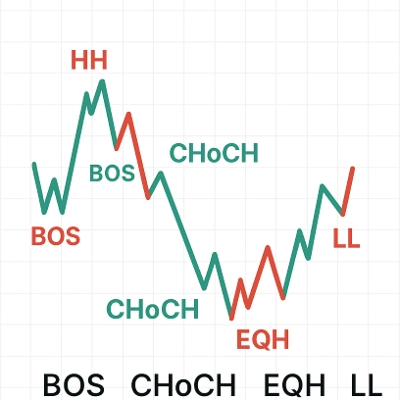
Dynamic Market Structure
Analysis of Turning Points
Fibonacci Linear
Regression Multi-timeframe
Multi-Level Candle Bias
Tracker
Auto Support and
Resistance Trend Lines
All Support and
Resistance Levels
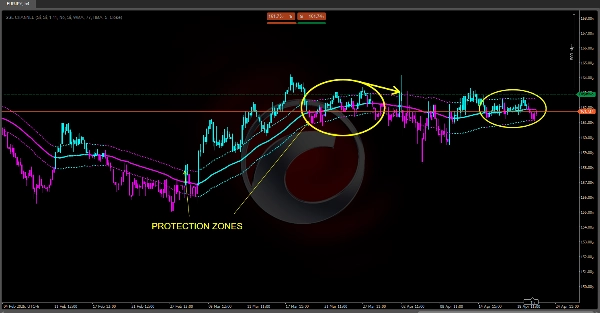
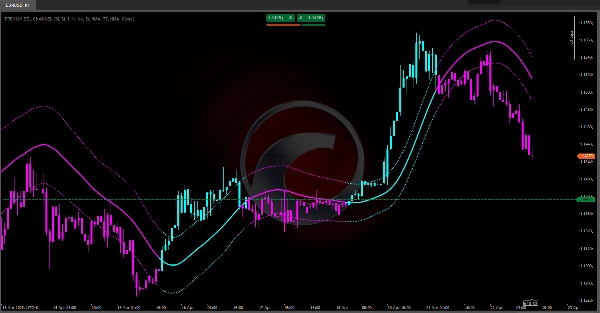
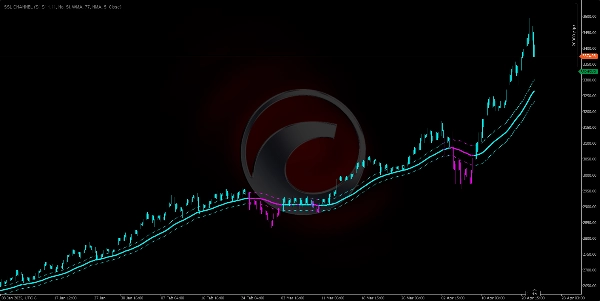
The Premium SSL Channel 🔍
Combines trend detection via a moving average, volatility assessment with ATR-based bands, and a short-term filter (SSL) to deliver an integrated analysis system. 💡 Its strength lies in the clarity of its visual signals and adaptability across markets, while its main challenge is minimizing lag and filtering sideways movements. With proper parameterization, it becomes a powerful tool for entry/exit decisions in trading. 🎯
1. Purpose & Trading Utility 📊
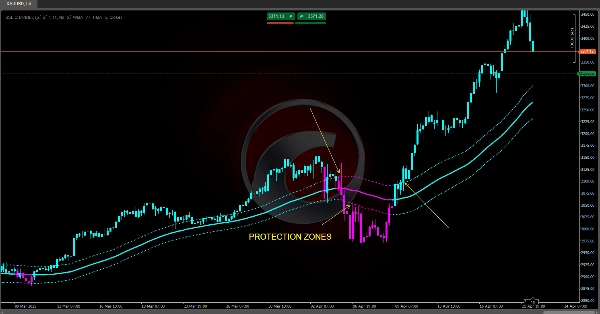
• Main trend detection: Thanks to a central line (the "Baseline"), the indicator shows the market’s dominant direction. 📈📉
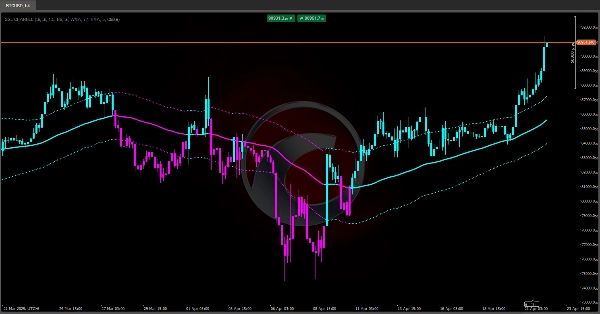
• Volatility measurement: Using an average range (ATR), it adjusts two bands (above/below the Baseline) as dynamic support/resistance zones. ⚡
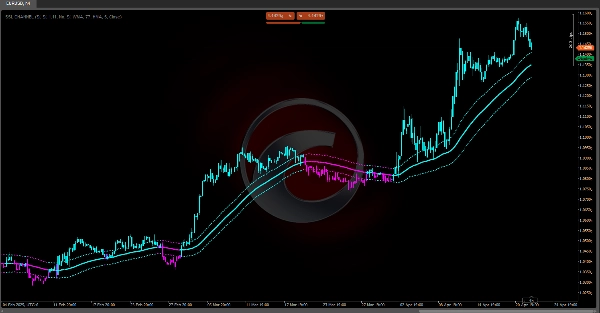
• Noise filter & bias shift: The SSL channel (an adaptive moving average based on highs/lows) identifies short-term reversals for precise entries/exits. 🔄
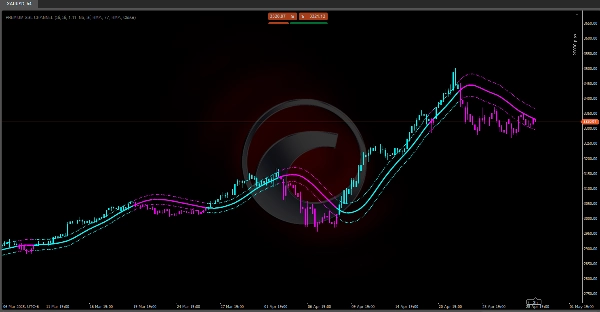
• Intuitive visualization: Colors price bars and lines by bias (cyan = bullish, magenta = bearish) for instant interpretation. 🎨
2. Core Components & Logic ⚙️
2.1. Central Line ("Baseline")
• Calculates a price moving average (SMA, EMA, WMA, or Hull) to smooth noise.
• Represents the market’s average value, showing the dominant trend:
- Price above → Bullish trend. 🟢
- Price below → Bearish trend. 🔴
2.2. Average Range (ATR)
• Measures real market volatility by averaging prior highs/lows/closes.
• Higher ATR = More volatility; Lower ATR = Calmer markets. 🌊
2.3. Dynamic Bands ("Up ATR" & "Down ATR")
• Up ATR = Baseline + (ATR × Multiplier)
• Down ATR = Baseline – (ATR × Multiplier)
• Acts as price channels:
- Price touching upper band → Bullish strength. 🚀
- Price near lower band → Bearish momentum. 🐻
2.4. SSL Channel (Signal-Smooth-Line)
• Uses moving averages on highs/lows separately.
• Direction logic:
- Close above high MA → Bullish bias. ✅
- Close below low MA → Bearish bias. ❌
- In-between → Prior bias holds.
• Acts as a short-term trend filter, confirming/contradicting the Baseline. 🔄
3. Signal Generation & Practical Use 🛠️
1. Trend Confirmation
- Strong Bullish: Price > Up ATR. 🟢
- Moderate Bullish: Up ATR > Price > Baseline.
- Moderate Bearish: Baseline > Price > Down ATR.
- Strong Bearish: Price < Down ATR. 🔴
2. SSL Filter
- Entries: Go long only if SSL is above its line (or short if below). ⬆⬇
- Exits: Partial/full exit when SSL reverses and crosses the opposite high/low MA. ✋
3. Bar Coloring
- Price bars turn cyan (bullish) or magenta (bearish), synced with the Baseline for quick market reads. 🎨
4. Configurable Parameters & Impact ⚖️
• Baseline Period: Longer = smoother but laggy; shorter = responsive but noisy. 🐢⚡
• Band Multiplier: Higher = wider channel (fewer false signals); lower = tighter (more signals, more whipsaws). ↔️
• MA Type (SMA/EMA/WMA/HMA): Affects weighting of recent vs. historical prices. 📅
• SSL Period & Type: Defines short-term filter sensitivity. 🎚️
5 | 100 % | |
4 | 0 % | |
3 | 0 % | |
2 | 0 % | |
1 | 0 % |