Smart Money Concept Indicator
Indicator
Version 1.0, Nov 2025
Windows, Mac
Description
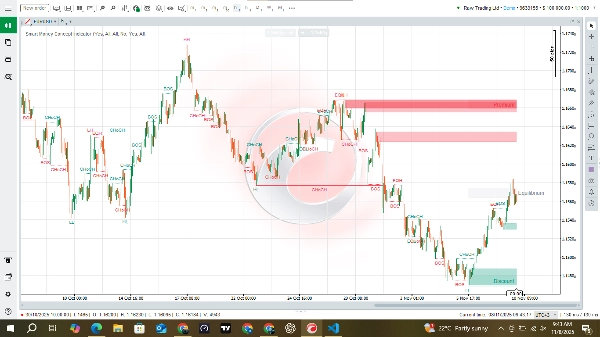
Smart Money Concepts — high-level overview
Smart Money Concepts visualizes where professional / institutional activity likely influenced price. It automatically identifies market structure (swing and short-term structure), highlights breaks of structure (BOS) and changes of character (CHoCH), finds equal highs/lows, captures candidate order-block ranges (areas where big players may have placed orders), and paints contextual zones (premium, equilibrium, discount). It adapts to market volatility so its thresholds scale with the instrument’s current activity.
What traders get at a glance
- Clear labels showing when structure flips or is broken (helping you determine bias).
- Highlighted order-block areas — potential supply/demand pockets where price often retests.
- Equal high/low markers — likely liquidity nodes for stop hunts or retests.
- Context zones — premium (expensive), equilibrium (fair value), discount (cheap) — useful for bias and targets.
- Trailing strong/weak highs & lows that show recent significant extremes.
Why this is useful for SMC traders
- Speeds level identification: draws and stores levels so you don’t manually hunt for pivots and OBs.
- Consistency: applies the same rules to spot structure flips and OB candidates across instruments and timeframes.
- Contextual entries: shows where institutional interest may lie — traders can plan entries on retests of those areas rather than guessing.
- Risk framing: zones and OB edges give logical places for stops and targets (e.g., stop beyond an OB low/high).
- Multi-scale workflow: use larger-scale structure for bias and smaller internal structure for precise entries.
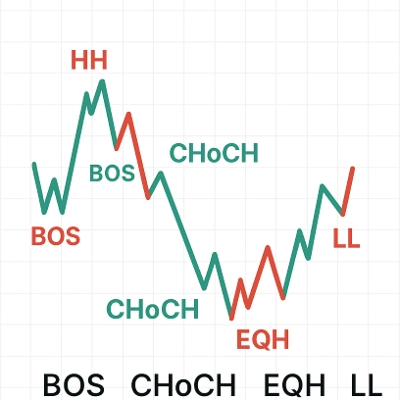
How to interpret the main elements
- BOS (Break of Structure) — continuation signal in the direction of the break; useful to confirm trend.
- CHoCH (Change of Character) — indication that the market’s behavior may be flipping; treat as potential reversal or shift in bias.
- Order Blocks (OBs) — price ranges where larger orders likely accumulated; expect retests and rejections there.
- Equal highs/lows — repeated levels where liquidity accumulates; often targeted before big moves.
- Premium/Equilibrium/Discount — a simple value map: premium favors sellers, discount favors buyers, equilibrium is neutral/mean.
Summary
Indicator profile
Customer reviews
0.0
Reviews: 0
Customer reviews
No reviews for this product yet. Already tried it? Be the first to tell others!
Discussion
FAQ
BTCUSD
Forex
Indices
EURUSD
Commodities
GBPUSD
Prop
SMC
Crypto
Stocks
XAUUSD
NAS100
USDJPY
Products available through cTrader Store, including trading bots, indicators and plugins, are provided by third-party developers and made available for informational and technical access purposes only. cTrader Store is not a broker and does not provide investment advice, personal recommendations or any guarantee of future performance.
More from this author


Price
Since 14/06/2025
1
Sales