
Description
Introducing the advanced QQE (Qualitative Quantitative Estimation) indicator, a powerful tool that combines two QQE indicators for enhanced trading insights.
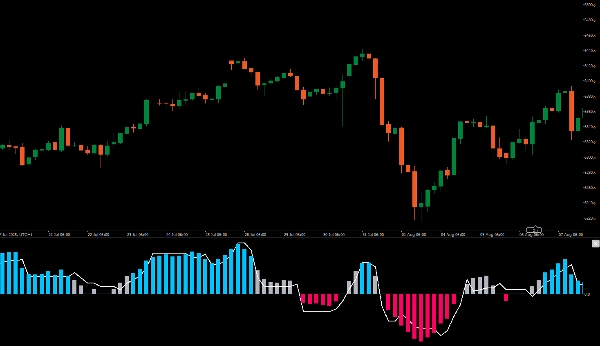
One QQE is displayed on the chart as columns, while the other operates in the background with a 50-period Bollinger Band acting as a zero line.
This setup allows you to visually gauge market momentum and identify potential entry points with clarity. When both QQE indicators align, you'll see clear blue or red bars, signaling strong buy or sell opportunities.
Elevate your trading strategy with the QQE indicator for more informed decisions and improved accuracy in your market analysis.Introducing the advanced QQE (Qualitative Quantitative Estimation) indicator, a powerful tool that combines two QQE indicators for enhanced trading insights.
One QQE is displayed on the chart as columns, while the other operates in the background with a 50-period Bollinger Band acting as a zero line.
This setup allows you to visually gauge market momentum and identify potential entry points with clarity. When both QQE indicators align, you'll see clear blue or red bars, signaling strong buy or sell opportunities.
Elevate your trading strategy with the QQE indicator for more informed decisions and improved accuracy in your market analysis.
Summary
Customer reviews
5 | 100 % | |
4 | 0 % | |
3 | 0 % | |
2 | 0 % | |
1 | 0 % |


!["[Hamster-Coder] Bollinger Bands" logo](https://cdn.ctrader.com/image/webp/21d8e5d6-fb11-4bac-b9ee-cd05c2b76804_30327)


