
MACD Crossover PRO
Indicator
3 purchases
Version 1.0, Oct 2025
Windows, Mac
5.0
Reviews: 1
Description
Introducing the customizable classic MACD indicator, designed to enhance your trading experience with personalized features.
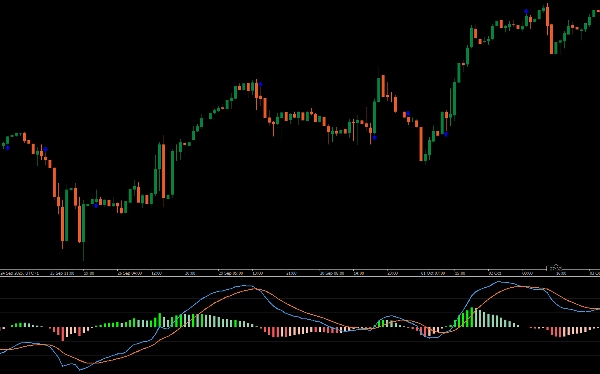
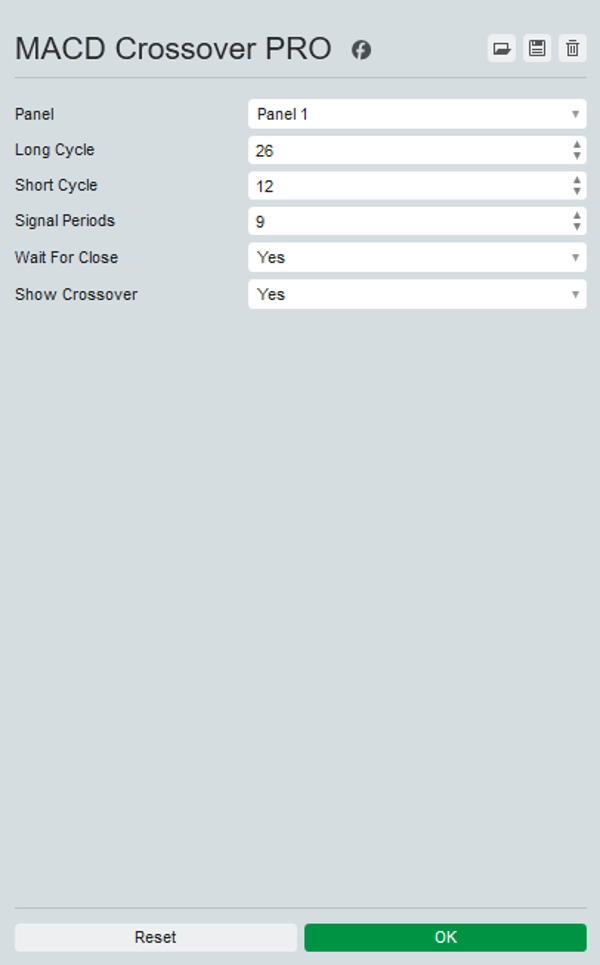
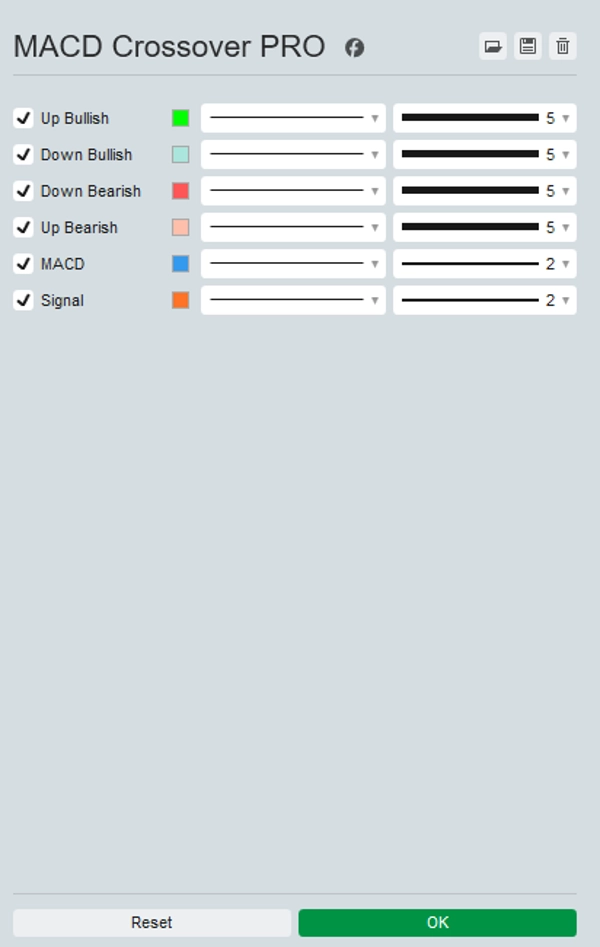
This upgraded version of the traditional MACD allows you to customize the colors of the lines and histogram for clearer chart visualization. Optionally, it can update in real time using tick data instead of candle close, providing timely insights in fast-paced markets.
Additionally, it highlights crossover points directly on the chart, making it easier to spot potential buy and sell signals.
Enhance your trading strategy with the customizable classic MACD indicator for improved accuracy and decision-making.
Summary
AI summary
MACD Crossover PRO is a customizable version of the classic MACD (Moving Average Convergence Divergence) indicator designed for enhanced trading analysis. It allows users to personalize the colors of the MACD lines and histogram for improved chart clarity. The indicator supports real-time updates based on tick data rather than waiting for candle closes, providing more immediate insights in fast-moving markets. It also visually highlights crossover points on the chart, aiding in the identification of potential buy and sell signals. This tool is applicable across various markets including Forex, cryptocurrencies, stocks, commodities, and indices, supporting symbols such as BTCUSD, EURUSD, GBPUSD, XAUUSD, NAS100, and USDJPY. The indicator is suited for traders employing strategies like scalping and signal-based entries, aiming to improve precision and decision-making through enhanced visualization and timely data updates.
Indicator profile
Customer reviews
5.0
Reviews: 1
5 | 100 % | |
4 | 0 % | |
3 | 0 % | |
2 | 0 % | |
1 | 0 % |
Customer reviews
October 15, 2025
The first test should keep DD under 3 percent. The review process gets less scattered.
Discussion
FAQ
BTCUSD
Forex
Signal
Indices
EURUSD
Commodities
GBPUSD
NZDUSD
Prop
Scalping
Crypto
Stocks
XAUUSD
NAS100
MACD
USDJPY
Products available through cTrader Store, including trading bots, indicators and plugins, are provided by third-party developers and made available for informational and technical access purposes only. cTrader Store is not a broker and does not provide investment advice, personal recommendations or any guarantee of future performance.


Price
Since 25/09/2025
25
Sales
315
Free installs