Brokers & props
For business
00
Days
:
00
Hours
:
00
Minutes
:
00
Seconds
Indicator
NAS100
NZDUSD
XAUUSD
Commodities
Forex
Signal
EURUSD
GBPUSD
BTCUSD
Indices
Prop
Stocks
Crypto
USDJPY
TSI True Strength Index
07/11/2025
Desktop
Since 25/09/2025
Sales
6
"TSI True Strength Index" uploaded image

Introducing the True Strength Index (TSI) indicator, a powerful tool designed to enhance your trading strategy by providing clear insights into market momentum and trend strength.

The TSI indicator measures the underlying strength of price movements, smoothing out market noise to give you a more accurate picture of trend direction. By highlighting overbought and oversold conditions, TSI helps you identify potential reversal points and confirm trend continuations.

TSI uses moving averages of the underlying momentum of a financial instrument. Momentum is considered a leading indicator of price movements, and a moving average characteristically lags behind price. The TSI combines these characteristics to create an indication of price and direction more in sync with market turns than either momentum or moving average.

Perfect for traders seeking to refine their analysis and improve decision-making, the TSI indicator offers a reliable and intuitive way to gauge market dynamics. Upgrade your trading toolkit with the True Strength Index for superior trading performance.

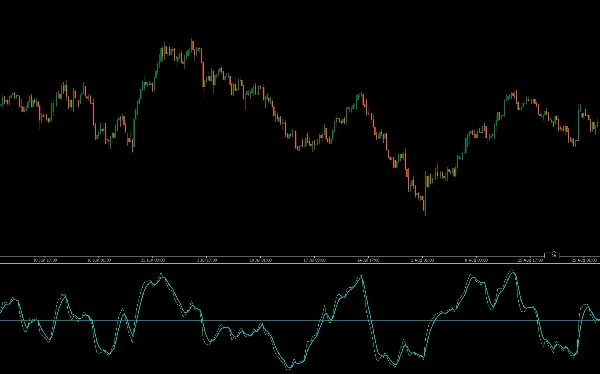
  • Trend identification: A positive TSI indicates a bullish trend, while a negative TSI suggests a bearish trend.
  • Momentum strength: It measures how strongly a trend is moving, with higher values indicating stronger momentum.
  • Potential reversal signals:
    • Crossovers: A signal line crossover near the zero line can signal potential entry and exit points.
    • Divergence: When the price makes a new high or low, but the TSI fails to do so, it can signal a potential trend reversal.
  • Overbought/oversold conditions: It can help identify when an asset may be overbought or oversold, though the specific overbought and oversold levels can vary depending on the asset's volatility. 
0.0
Reviews: 0
Customer reviews
No reviews for this product yet. Already tried it? Be the first to tell others!
More from this author
Indicator
NAS100
NZDUSD
XAUUSD
+13
Chandelier Exit
Optimize exits with Chandelier Exit! Visualize stop-loss points dynamically for improved trading precision and safety.
Indicator
NAS100
NZDUSD
Breakout
+12
ATR Bands
Enhance trading with ATR Bands! Visualize market volatility using dynamic upper and lower ATR bands for precise decision
Indicator
NAS100
NZDUSD
XAUUSD
+13
MACD Crossover PRO
Customize the MACD! Choose colors, get real-time tick updates, and see crossover points for enhanced trading precision.
Indicator
NAS100
NZDUSD
XAUUSD
+10
Moving Average PRO
Customize your Moving Average! Choose any timeframe and price source for precision and flexibility in your analysis.
Indicator
NAS100
NZDUSD
Breakout
+14
Bollinger Bands Cloud
Visualize Bollinger Bands with a colored cloud for clarity. Enhance your trading precision with this dynamic indicator!
Indicator
NAS100
NZDUSD
Breakout
+13
VWAP Volume Weighted Average Price
Unlock VWAP in cTrader! Choose anchor periods, price sources, and display deviation bands with real-time tick updates.
Indicator
Grid
NAS100
NZDUSD
+13
Standard Deviation Channel
Visualize trends with Standard Deviation Channel! Display median, and add customizable upper/lower deviation channels.
Indicator
NAS100
NZDUSD
XAUUSD
+11
TradingView ATR
Upgrade to ATR-RMA! Experience the precise ATR using Relative Moving Average for accurate volatility analysis in cTrader
Indicator
NAS100
RSI
NZDUSD
+13
Stochastic RSI PRO
Unlock Stochastic RSI PRO in cTrader! Overlay RSI, highlight zones, and identify divergences with customizable settings.
Indicator
NAS100
NZDUSD
XAUUSD
+11
Consolidation Zones
Identify and trade breakouts with Consolidation Zones! Visualize price consolidation areas for trading opportunities.
Indicator
NAS100
NZDUSD
XAUUSD
+13
MACD Histogram PRO
Enhance MACD Histogram! Visualize bull and bear price changes with vibrant colors for clearer, more insightful trading.
Indicator
NAS100
NZDUSD
XAUUSD
+12
QQE Qualitative Quantity Estimation
Unlock trading precision with QQE! Dual QQE indicators with a Bollinger Bands zero line provide clear buy/sell signals.
You may also like
Indicator
NAS100
NZDUSD
XAUUSD
+8
Squeeze Breakout Regression System
💥Detects moments when the market is "compressed" and about to explode in any direction 💥
Indicator
EURUSD
Compare Symbol
Plots chosen symbol's close price, candlestick (wick, body) on cTrader chart, supports multiple timeframes.
Indicator
NAS100
NZDUSD
XAUUSD
+17
Logarithmic Market Map Pro
Map true market structure with logarithmic precision — see balanced ranges and swing alignment instantly.
Indicator
Grid
NAS100
NZDUSD
+18
Zig Zag ATR
ZigZag Pro — Advanced swing detection with ATR threshold, fractal confirmation, and colored segments. Clean market
Top-rated
"STC" logo
5.0
(2)
Free
STC
Schaff Trend Cycle (STC) Indicator
Indicator
Stocks
Forex
Signal
+1
Engulfing Pattern Indicator
Trend Volatility Trail
A volatility-adaptive trend-following indicator that dynamically adjusts to market conditions.
Time To Break Even Indicator v2
Time To Break Even Indicator. This indicator helps you time your trade's entry.
Indicator
ATR
Supertrend
supertrend
Supertrend Indicator for cTrader
Laguerre RSI
Laguerre RSI is based on John EHLERS' Laguerre Filter to avoid the noise of RSI.
Risk Reward Guardian Scalping Swing Intraday Assistant
Trade fearlessly: auto-adjusts order blocks, manages risks, and ensures precision.
Insider_CumulativeDelta
Robust Cumulative delta,Atr and imbalance indicator.
Indicator
NZDUSD
Forex
EURUSD
+2
AlgoCorner Market Sessions
Show each Market Session with full details, including grid mode for higher timeframes, statistics, and other metrics.
Indicator
NAS100
NZDUSD
Breakout
+14
Bollinger Bands Cloud
Visualize Bollinger Bands with a colored cloud for clarity. Enhance your trading precision with this dynamic indicator!
Indicator
Breakout
XAUUSD
Prop
+4
Gold Inicial Balance Basic
Basic & FREE. Plots New York Initial Balance (NY local time) and projects IB High, IB Low, and midline.
Indicator
XAUUSD
Breakout
Stocks
+6
Signal Strike
Signal Strike is a professional trading indicator delivers clear, high‑confidence entry signals directly on your chart
Supertrend TV
REAL Supertrend because default Ctrader Supertrend gives different signals
Tiny_Aim_Trainer
trading stress-relief “mini-game”