"MarketSession-MX" logo
MarketSession-MX
4.3
Reviews: 3
"MarketSession-MX" uploaded image
135
Sales
10.59K
Free installs

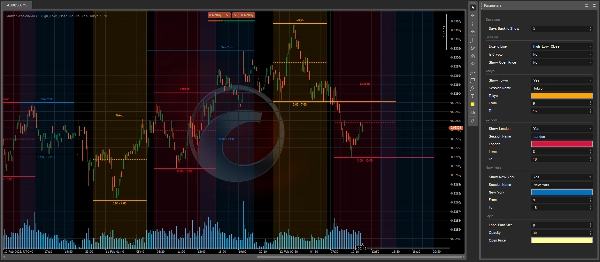
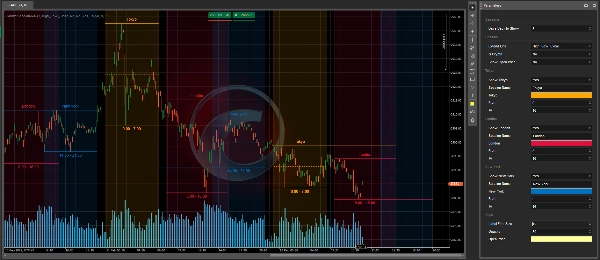
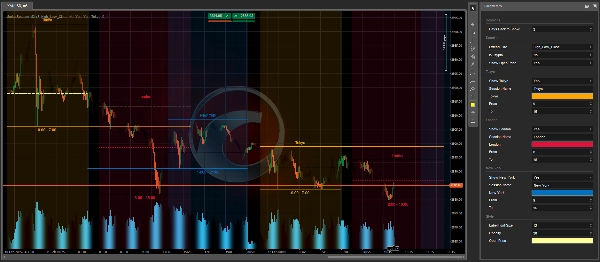
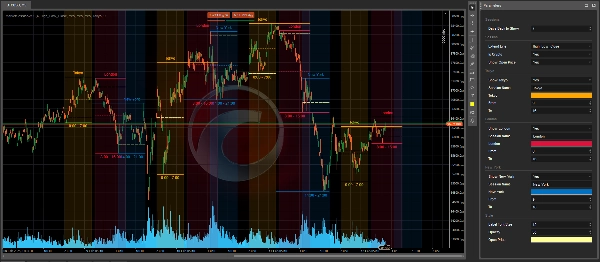
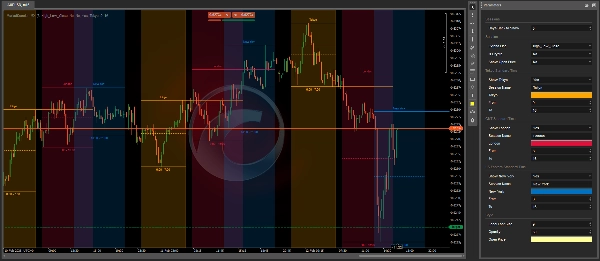
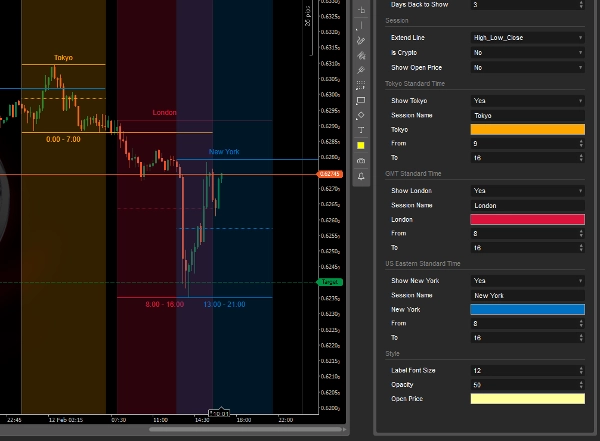
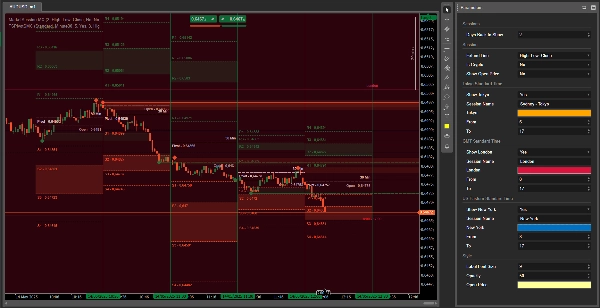
New version of MarketSession, I have changed the way the hours are displayed, now the time is marked with the opening and closing hours of the area.

It works with timeframes between 1 minute and 1 hour, above 4 hours it is hidden.

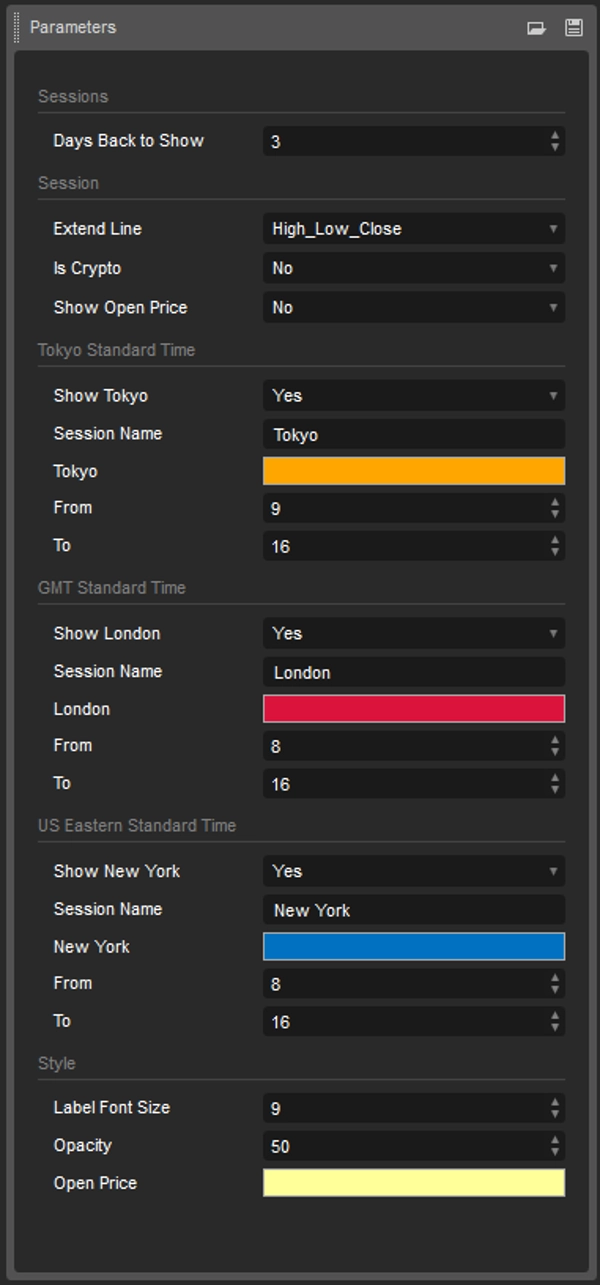
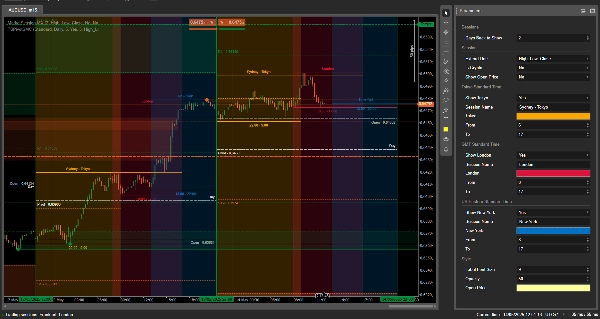
There are only three sessions, since Sydney and Tokyo are scheduled at the same time, but are 2 hours apart. In the settings, you can configure the Tokyo start time and Sydney end time, and change the name to whatever you want. Additionally, a day can be divided with TSPivotSM into intervals from 15 minutes to 12 hours, and beyond, from 1 day to 1 month.

I'm updating some options and they're synced with the cloud. So, those who have purchased it should be able to update by trying to download it again. If not, the problem is with CTrader.

The rest is the same as before.

With additional tools like

TSPivotSMC https://ctrader.com/products/3137?u=Thomas-Sparrow

OrderPrice V3 https://ctrader.com/products/397

NTMPICLL https://ctrader.com/products/327

RangeBoxFibonacci https://ctrader.com/products/526

MacdVolume https://ctrader.com/products/267

4MA https://ctrader.com/products/247


Good luck 😀

Indicator profile
4.3
Reviews: 3
5
67 %
4
0 %
3
33 %
2
0 %
1
0 %
Customer reviews
August 28, 2025
This is a solid choice for intraday traders and scalpers who rely on session activity, Professional traders, however, may need more advanced analytics and automation features.
May 8, 2025
I would like to set half hour (like 9:30), this is note possible.
April 24, 2025
Works great so far!. Please could you consider adding a 4th session (Sydney) that works exactly like the other 3?? thank you!
BTCUSD
Forex
Indices
EURUSD
Commodities
GBPUSD
NZDUSD
Prop
Crypto
Stocks
XAUUSD
NAS100
USDJPY
Products available through cTrader Store, including trading bots, indicators and plugins, are provided by third-party developers and made available for informational and technical access purposes only. cTrader Store is not a broker and does not provide investment advice, personal recommendations or any guarantee of future performance.

More from this author

VWAP only timeframe
This technical analysis indicator provides information on market sentiment, trend and price levels....
This indicator consists of 3 moving averages that can be configured to your liking, from the type of moving average....
😎Read the description before purchasing💩
This bot can automatically generate buy and sell orders based on three specific Fixed bugs.
With this Fibonacci retracement indicator, traders have full control over the retracement levels displayed on the chart.
🔍 Discover All Candlestick Patterns… Absolutely Free!
A straightforward yet effective tool signals entry points for both buying and selling. Include 3 Moving Average
Session One is a tool for marking from to, useful if you've set the hours you want to trade
🚀 HAI QUANTUM v4.0 | The Ultimate Quantum Terminal for cTrader (Smart Money & Algorithmic Trading)
The Parabolic SAR, or "Stop and Reverse," is a dynamic technical analysis tool.

You may also like

VPDI (open, close, high and low with % of the previous day and price changes in % of the previous day's close)
True Deviation - Trade extremes and reversions with deviation channels, SMC swings, liquidity levels, and impulse bias.
Future-AI indicator.
Daily Pivot Points plots key support and resistance levels to guide precise trading decisions.
Scalp UI Pro is the ideal tool for scalping. It makes it easy to place orders and quickly.
Clarosti a chave para decisões inteligentes no mercado
QX SessionBox ORB: Session boxes + ORB levels + clean dashboard with optional closed-candle breakout signals.
The Advanced Volume Profile Indicator calculates POC, Median, and Mode, revealing key price levels for smarter trading.
Larry Williams 9.1
Plots the ATR on the chart for easy visualization.
Buy at green arrow if trend is bullish and viceversa
Designed to identify and visualize price reversal patterns using Bézier curves.
Visualizes potential momentum shifts before market direction changes.
Displays the previous day's, last week's, and last month's highest and lowest price levels on your chart.
Ultimate Market Footprint: Price Action Zones (Gaps + Order Blocks + Signals)
Real-time multi-asset correlation matrix with 5 themes, Δ% performance tracking, and full customization. Up to 12 symbol
The RSI NextGen is an advanced and modernized version of the classic Relative Strength Index (RSI)
The long awaited new and improved Supply Demand Premium V2 indicator. Unlock greater trading opportunities now!
135
Sales
10.59K
Free installs