
Description
✅ Detects high- and low-probability turning points using advanced pivot logic
✅ Fully customizable Depth, Deviation & Backstep engines
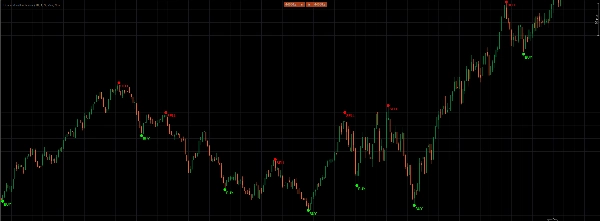
✅ Automatically plots clear BUY and SELL labels on the chart
✅ Optional pivot markers and current-bar highlights for extra clarity
✅ Designed to capture early reversals with precision and confidence
Unleash precision trading with the Buy & Sell Indicator: a powerful, pivot-based signal engine that spots high- and low-turning points using customizable depth, deviation and backstep settings. Configure your DepthEngine, DeviationEngine and BackstepEngine to fine-tune sensitivity, then let the indicator automatically plot clear “BUY” and “SELL” labels—complete with optional pivot and current-bar markers in your favorite colors—so you never miss a trend reversal again! Trade smarter, not harder.
Summary
Customer reviews
5 | 33 % | |
4 | 67 % | |
3 | 0 % | |
2 | 0 % | |
1 | 0 % |


