
Description
⚠️Update out enjoy real depth info⚠️
🔥 HEAT MAP DASHBOARD 📈
An Institutional-Grade Order Flow & Momentum Terminal for cTrader.
The Heat Map Dashboard isn't just a basic chart overlay—it is a three-part trading ecosystem built directly into your platform. It gives you "X-Ray" vision into market liquidity, true volume-weighted averages, and macro-level trends, all without slowing down your computer. ⚡
🎯 What It Does (The Trader's View)
The system breaks your trading down into three simple steps:
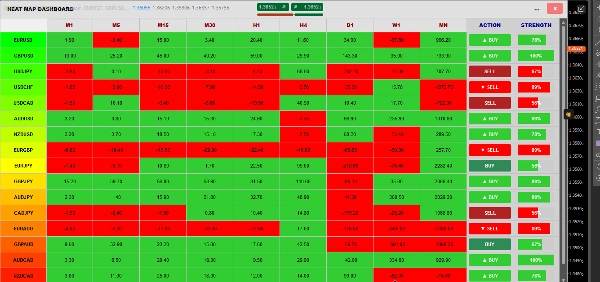
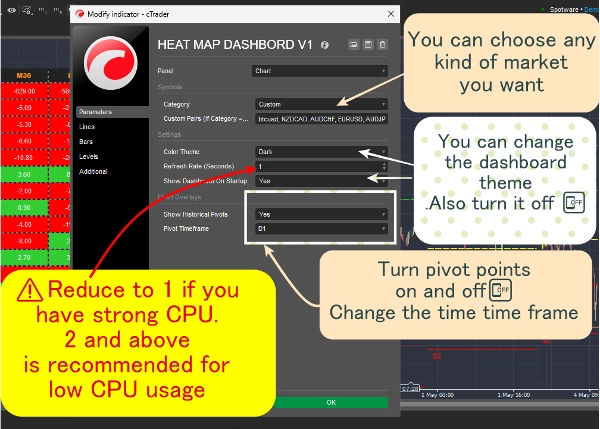
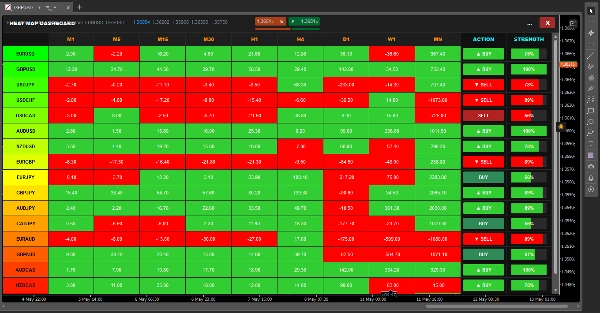
- 🎛️ Step 1: WHAT to trade (The Matrix). Instead of clicking through dozens of charts, the dashboard scans 17 different assets across 9 timeframes (M1 to Monthly). It calculates the momentum for every single cell and color-codes it. At a single glance, you know exactly which pair is in a massive trend and ready to trade.
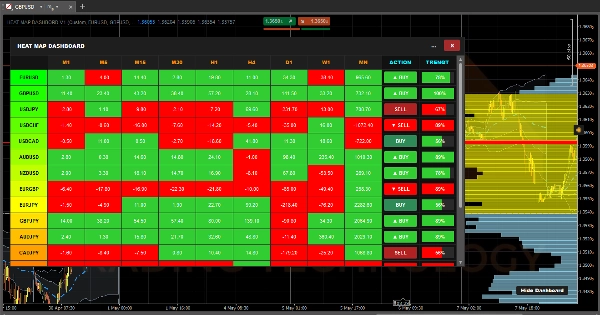
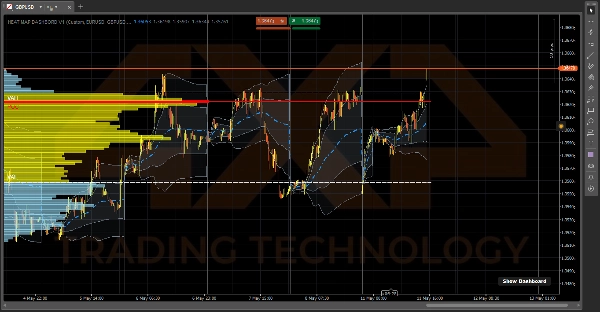
- 🌊 Step 2: WHO is in control (The VWAP). Once you pick a pair, look at the Daily Anchored VWAP. It shows you the true average price based on volume, not just candlesticks. The shaded Standard Deviation clouds act as dynamic support/resistance, showing you exactly when the market is heavily overbought or oversold.
- 📊 Step 3: WHERE to enter (The VRVP). Finally, the Visible Range Volume Profile maps out exactly where the heavy institutional liquidity is resting. It automatically draws your Point of Control (POC) and 70% Value Area (VAH & VAL) lines, giving you pinpoint accurate levels to execute your entries and exits.
⚙️ How It Works (Under the Hood)
Most indicators that try to do this much math will instantly freeze your platform and crash cTrader to 100% CPU usage. To prevent that, the Heat Map Dashboard is powered by three highly optimized, independent engines running simultaneously:
1. The Dashboard Engine (The 2-Second Heartbeat) ⏱️ If we calculated 153 combinations (17 pairs x 9 timeframes) on every single price tick, your computer would melt. Instead, this engine runs on a strict 2-second heartbeat timer. Every 2 seconds, it silently looks at the price from 14 candles ago, compares it to the current price, and paints the cell Green (positive momentum) or Red (negative momentum).
2. The VRVP Engine (The Screen Reader) 🖥️ Instead of loading thousands of bars of historical data, the Volume Profile acts as a dynamic "Viewport Listener." It only fires when you physically zoom or scroll your chart. It asks cTrader exactly which candles are currently visible on your screen, calculates the exact volume overlap for those specific bars, and instantly redraws the 70% Value Area.
3. The VWAP Engine (The Tick Accumulator) 🧮 The VWAP is the only thing that calculates on the live tick. However, to keep it lightning-fast, it uses a lightweight "Cumulative Data Series." Instead of recalculating the whole day every second, it simply adds the new tick's volume to a running background total, and automatically wipes itself clean the exact millisecond the clock strikes midnight.
4. The Window Manager (The Shape-Shifter) 🪟 The dashboard is wrapped in a custom C# sizing logic that actively listens to your monitor. When you hit the Maximize [ ] or Restore [=] buttons, the indicator dynamically reads your Chart.Width and Chart.Height in real-time, instantly shape-shifting to fit your screen perfectly without collapsing!
Summary
1. Market Momentum Matrix: Scans 17 assets across 9 timeframes (from 1 minute to monthly), calculating and color-coding momentum to identify trending pairs quickly.
2. Daily Anchored Volume Weighted Average Price (VWAP): Displays true average prices weighted by volume, with dynamic standard deviation clouds indicating overbought or oversold conditions.
3. Visible Range Volume Profile (VRVP): Maps institutional liquidity by highlighting the Point of Control (POC) and 70% Value Area (VAH & VAL) within the visible chart range, aiding precise entry and exit levels.
The dashboard operates via four optimized engines: a 2-second heartbeat engine for momentum updates, a viewport-driven VRVP engine for volume profile recalculations, a tick-accumulating VWAP engine for real-time volume-weighted pricing, and a dynamic window manager that adjusts the interface to fit the chart size. This architecture ensures efficient performance and real-time responsiveness. The indicator supports visualization, signals (including trend strength, breakouts, and reversals), and filtering based on tick data, volume, and market structure analysis. It is tagged for aggressive trading, market structure, liquidity sweeps, support/resistance, and risk dashboard functionalities.
Customer reviews
5 | 100 % | |
4 | 0 % | |
3 | 0 % | |
2 | 0 % | |
1 | 0 % |


