
RSI Velocity Gauge
Indicator
71 downloads
Version 1.0, May 2026
Windows, Mac
5.0
Reviews: 1
Description
FREE FOR ALL
🏎️ RSI Velocity Gauge Pro 📊
The Ultimate Real-Time Momentum HUD & Trend Visualizer for cTrader
Transform how you view market momentum with the RSI Velocity Gauge Pro. Say goodbye to messy, detached oscillator sub-windows. This premium indicator overlays a sleek, mechanical dashboard directly onto your chart, giving you an instantaneous, high-fidelity reading of market speed, strength, and exhaustion points.
Engineered with advanced trigonometric UI scaling and live chart-painting logic, this is more than an indicator—it’s a complete executive control center for your trading layout.
⚡ Key Features
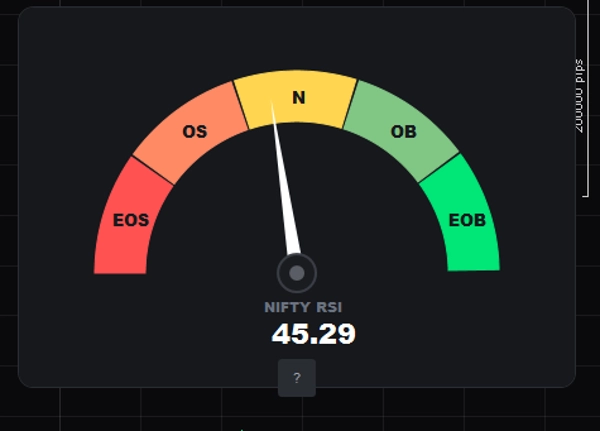
- 🧭 Dynamic Mechanical Dashboard: A stunning, dark-mode radial speedometer that tracks the Relative Strength Index (RSI) live on every single tick.
- 🎨 Psychologically Correct Color Coding: Perfectly inverted to match real-time market pressure. Left side represents overwhelming seller control (Red/Orange), while the right side displays aggressive buyer velocity (Green/Mint).
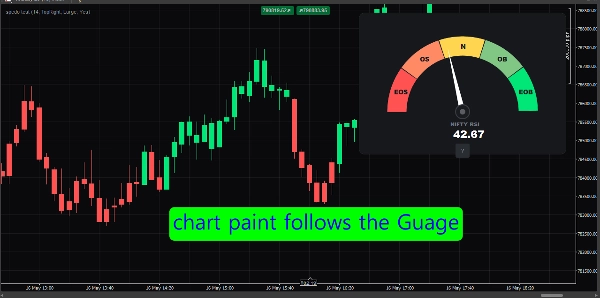
- 🕯️ Smart Candle Painting: Keep your eyes locked on the price action. The indicator automatically paints your chart candles green during bullish momentum (RSI > 50) and red during bearish environments (RSI < 50).
- 🧠 Interactive Pop-up Legend (
?Button): Keep your charts clean and minimalist. Click the interactive circular?button to instantly toggle an elegant, elevated zone key detailing exact abbreviations and their corresponding colors. - 📐 Fully Responsive UI Scaling: Choose between Small, Medium, or Large views. The indicator dynamically calculates all geometries, font sizes, margins, and border radiuses to fit perfectly on any monitor resolution (including 4K).
- 📍 Fluid Corner Positioning: Easily shift the gauge out of the way of critical price action. Toggle between Top-Left, Top-Right, Bottom-Left, or Bottom-Right with automated padding adjustments.
- 🎛️ Native Color Pickers: No tedious hex codes required! Customize the color of all 5 zones and trend candles using cTrader's seamless dropdown color grids.
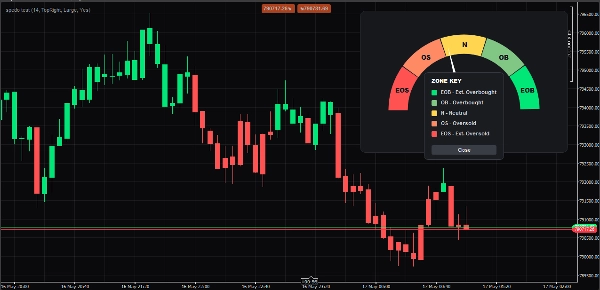
🔍 The Zone Legend Key
Click the inline ? button on your dashboard to see your custom zone rules:
- 🟥 EOS (Extreme Oversold | 0–20): Maximum selling exhaustion. Potential reversal zone.
- 🟧 OS (Oversold | 20–40): Strong bearish velocity. Bears are in firm control.
- 🟨 N (Neutral | 40–60): The market equilibrium zone. Sideways or consolidating action.
- 🟩 OB (Overbought | 60–80): Strong bullish velocity. Bulls are in firm control.
- 🟩 EOB (Extreme Overbought | 80–100): Maximum buying exhaustion. Potential pullback zone.
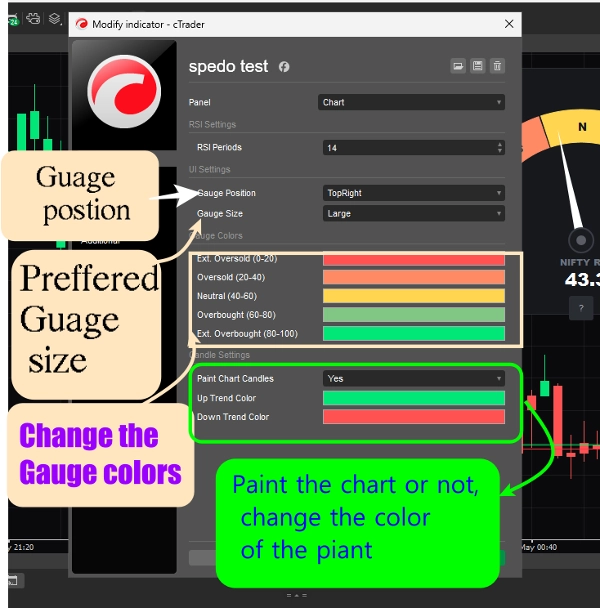
⚙️ Customizable Parameters
- RSI Settings: Adjust your calculation periods effortlessly (Default: 14).
- UI Positioning: Dropdown layout selector (Top-Left, Top-Right, Bottom-Left, BottomRight).
- UI Sizing: Seamless responsive scaler (Small, Medium, Large).
- Gauge Colors: Independent palette pickers for all 5 momentum bands.
- Candle Settings: Global toggle to enable/disable background candle painting, featuring custom Up and Down trend brush selectors.
Summary
AI summary
The RSI Velocity Gauge is a momentum indicator designed for cTrader that overlays a dynamic, mechanical-style dashboard directly on trading charts. It provides real-time tracking of the Relative Strength Index (RSI) on every tick, visualized as a radial speedometer with color-coded zones indicating market momentum and pressure. The gauge uses a dark-mode interface with colors representing seller dominance (red/orange) and buyer dominance (green/mint).
Key features include automatic candle coloring to reflect bullish (green) or bearish (red) momentum based on RSI values, an interactive pop-up legend explaining zone meanings, and fully responsive UI scaling with adjustable sizes (small, medium, large) and corner positioning options. Users can customize RSI calculation periods, gauge colors for five momentum bands, and toggle candle painting on or off.
The indicator divides RSI values into five zones: Extreme Oversold (0–20), Oversold (20–40), Neutral (40–60), Overbought (60–80), and Extreme Overbought (80–100), helping identify potential reversal or exhaustion points. The RSI Velocity Gauge serves as a comprehensive momentum visualization tool, integrating smoothly into trading layouts for enhanced market speed, strength, and trend analysis.
Indicator profile
Indicator category
Momentum
Output type
Visualisation
Filter
Signals
Data requirements
Bars only
Tick data
Volume
DoM
External data
Supported signals
Volatility
Trend strength
Level break
Level touch
Reversal
Cross
Divergence
Breakout
Customer reviews
5.0
Reviews: 1
5 | 100 % | |
4 | 0 % | |
3 | 0 % | |
2 | 0 % | |
1 | 0 % |
Discussion
FAQ
RSI
AI-assisted
Moving Average
Products available through cTrader Store, including trading bots, indicators and plugins, are provided by third-party developers and made available for informational and technical access purposes only. cTrader Store is not a broker and does not provide investment advice, personal recommendations or any guarantee of future performance.
More from this author


!["[CB] Pivot Points Pro" logo](https://cdn.ctrader.com/image/webp/43463c82-67b0-4f10-a4ba-901bba091d81_32594)


Price
Since 27/02/2026
33.16K
Traded volume
25.96K
Pips won
8
Sales
365
Free installs