
Description
| ALL IN ONE TRADING PRO|
## What Is This Indicator?
This indicator puts **three helpful trading tools** on your chart at once. Think of it like having three expert traders giving you their opinion at the same time
=====================================================
## The Three Tools
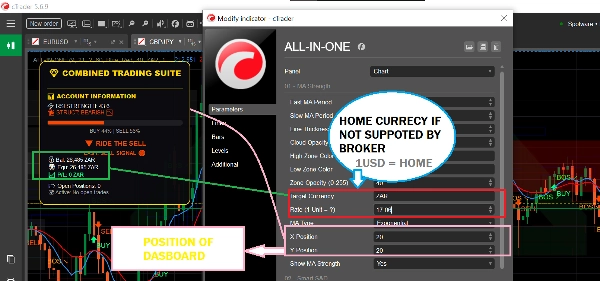
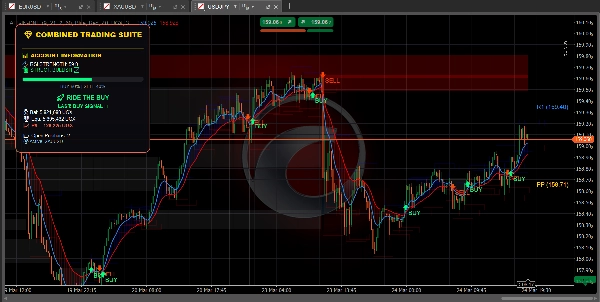
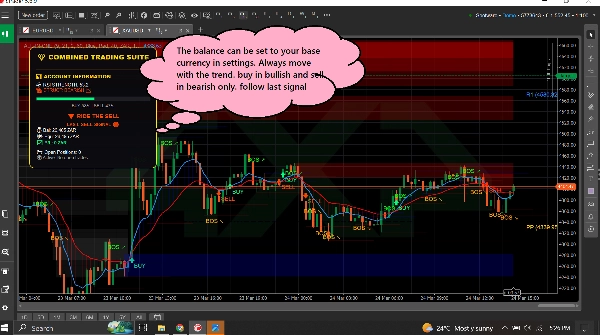
### 1. TREND DASHBOARD (The Trend Tracker)
**What it does:** Tells you which direction the market is moving and how strong the move is.
**What you see:**
- **Blue line** = Fast moving average (short-term trend)
- **Red line** = Slow moving average (long-term trend)
- **Blue cloud** = Uptrend (price going up)
- **Red cloud** = Downtrend (price going down)
- **Green arrow** = BUY signal appears
- **Red arrow** = SELL signal appears
- **RSI bar** = Shows if market is overbought (too high) or oversold (too low)
========================================================
**Also shows:**
- Your account balance and profit/loss
- How many positions you have open
- Simple text advice like "SAFE TO BUY" or "RIDE THE BUY"
============================================================
### 2. SUPPLY & DEMAND ZONES (The Key Level Finder)
**What it does:** Finds important price levels where the market might reverse or stall.
**What you see:**
- **Blue boxes** = Demand zones (areas where buyers step in - GOOD for buying)
- **Red boxes** = Supply zones (areas where sellers step in - GOOD for selling)
- **Gray boxes** = Zones that have been tested (less reliable)
============================================================
**How to use:**
- Price going DOWN toward a blue box? Look to BUY
- Price going UP toward a red box? Look to SELL
- Fresh (bright) boxes work better than gray ones
============================================================
**Also shows:**
- **BOS ↗** = Market broke higher, trend may continue up
- **BOS ↘** = Market broke lower, trend may continue down
============================================================
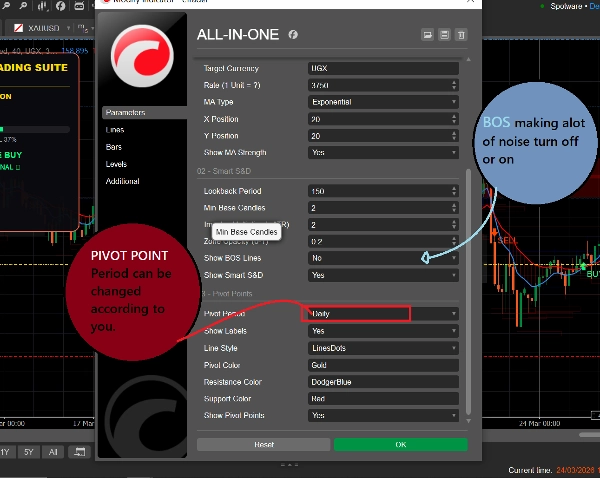
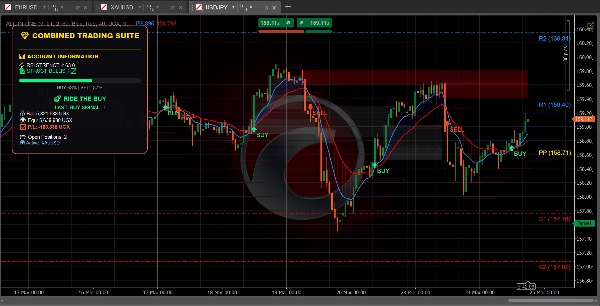
### 3. PIVOT POINTS (The Support & Resistance Levels)
**What it does:** Calculates automatic price levels where the market often stops or turns.
**What you see:**
- **Gold line** = Pivot point (center level)
- **Blue lines** = Resistance levels (price may go down here)
- **Red lines** = Support levels (price may go up here)
============================================================
**You can choose:**
- **Daily** = Levels change once per day
- **Weekly** = Levels change once per week
- **Monthly** = Levels change once per month
- **15-Minute** = Levels change every 15 minutes (good for fast trading)
============================================================
## How to Use It (Simple)
### To Find a BUY Trade:
1. Wait for price to reach a **blue demand box**
2. Check if the blue MA line is above the red MA line (uptrend)
3. The signals should be followed only if the market is in the right trend
============================================================
### To Find a SELL Trade:
1. Wait for price to reach a **red supply box**
2. Check if the red MA line is above the blue MA line (downtrend)
3. The signals should be followed only if the market is in the right trend
============================================================
### To Find Quick Trades:
1. Use 15-minute pivot points for precise levels
2. Watch for BOS arrows for trend direction
3. Check the dashboard for market strength
4. Take trades that match the direction
============================================================
## What All the Colors Mean
| Color | What It Means |
| 🟦 Blue | Bullish / Buy signals / Demand zones / Resistance pivots |
| 🔴 Red | Bearish / Sell signals / Supply zones / Support pivots |
| 🟨 Gold | Pivot point (center level) |
| ⚪ Gray | Tested zones (already visited) |
| 🟢 Green Arrow | BUY signal |
| 🔴 Red Arrow | SELL signal |
============================================================
## Simple Settings for Beginners
============================================================
### For Fast Trading (Scalping):
- Pivot Period: **15-Minute**
- Fast MA: **5**
- Slow MA: **13**
- Turn on: All three tools
============================================================
### For Day Trading:
- Pivot Period: **Daily**
- Fast MA: **9**
- Slow MA: **21**
- Turn on: All three tools
============================================================
### For Long-Term Trading:
- Pivot Period: **Weekly**
- Fast MA: **21**
- Slow MA: **55**
- Turn on: Trend Dashboard + Pivot Points
=========================================================
## One Rule to Remember
=========================================================
**Don't trade when the tools disagree!**
If the dashboard says BUY, but price is at a red supply zone - wait for clarity.
If the dashboard says SELL, but price is at a blue demand zone - wait for clarity.
The best trades happen when ALL tools point in the same direction.
============================================================
## Quick Start
1. Add the indicator to your chart
2. Keep all settings at default to start
3. Watch how price behaves at the colored boxes and lines
4. After a few days, adjust settings to match your style
5. Use the dashboard to monitor your account in real-time
============================================================
That's it! Three tools, one indicator, simple trading.
Summary
1. Trend Dashboard: Displays short-term (blue line) and long-term (red line) moving averages, colored clouds indicating uptrend (blue) or downtrend (red), buy (green arrow) and sell (red arrow) signals, and an RSI bar showing overbought or oversold conditions. It also shows account balance, open positions, and simple text advice.
2. Supply & Demand Zones: Highlights important price levels with blue boxes for demand zones (buying areas), red boxes for supply zones (selling areas), and gray boxes for tested zones (less reliable). It includes breakout signals (BOS arrows) indicating potential trend continuation.
3. Pivot Points: Automatically calculates support and resistance levels with a gold pivot point line, blue resistance lines, and red support lines. Users can select pivot periods from 15-minute to monthly intervals for different trading styles.
The indicator supports multiple markets including Forex, Crypto, Stocks, and Indices, and provides visual signals such as crossovers, breakouts, and level touches. It is designed for various trading styles, from scalping to long-term trading, with recommended settings for each. The tool emphasizes trading only when all three components align in direction to improve trade clarity and consistency.
Customer reviews
5 | 100 % | |
4 | 0 % | |
3 | 0 % | |
2 | 0 % | |
1 | 0 % |


