
VegaXLR - ZigZag Alerts
Indicator
10 purchases
Version 1.0, Feb 2025
Windows, Mac
4.3
Reviews: 3
Description
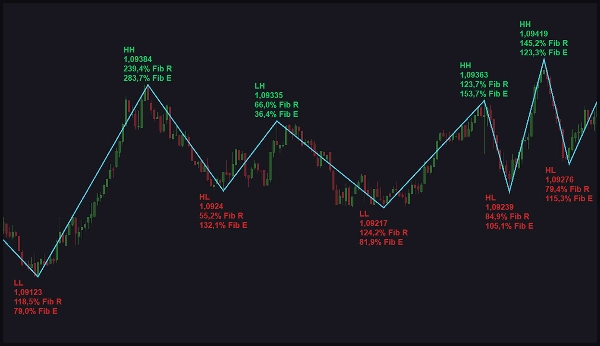
The cTrader ZigZag Alerts indicator helps you track price swings by plotting Higher Highs, Higher Lows, Lower Lows, and more. It also calculates Fibonacci retracements and expansions by comparing swings. The ZigZag line stays consistent across all symbols, timeframes, and price ranges for reliable analysis.
Key Features:
- Adjustable Sensitivity: Customize how the indicator detects swings based on market conditions.
- Label Options: Choose between abbreviated or full labels for clear visualization.
- Font & Color Customization: Modify text size and define bullish/bearish colors for better readability.
- Swing Labels & Prices: Display swing labels with corresponding prices for better insights.
- Fibonacci Levels: View Fibonacci retracement and expansion levels for improved entry and exit points.
- Alert Management: Pause all alerts instantly when needed.
- Custom Comments: Add comments that appear in alerts for easy identification.
- Multiple Alert Options: Receive alerts via sound, pop-ups, Telegram, or email.
- Swing-Specific Alerts: Get alerts for selected swing types and pause alerts for a set time.
- Fibonacci Alerts: Stay informed with alerts on Fibonacci retracements and expansions.
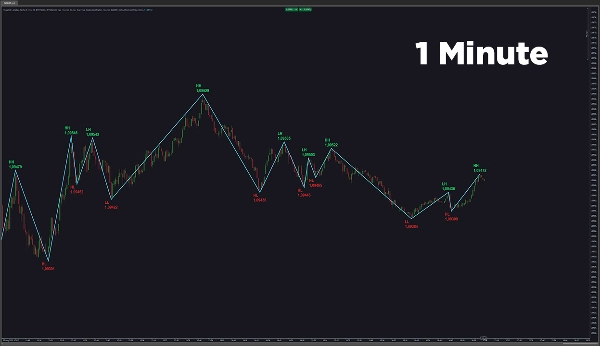
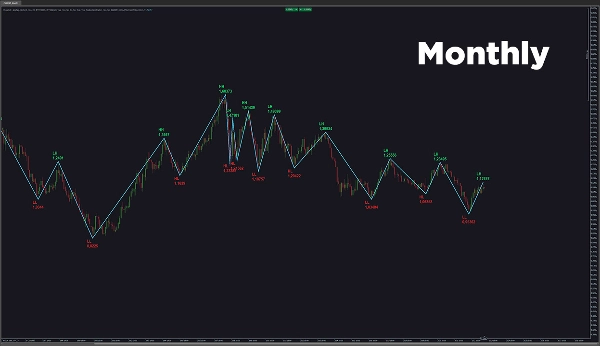
- Consistent ZigZag Line: Unlike other indicators, this maintains uniform swing detection across all timeframes and price ranges.
- User Guide: You can quickly access the user guide through a button on the chart.
cTrader ZigZag Alerts provides precise swing detection and alert customization, helping traders make informed decisions with confidence.
Summary
AI summary
VegaXLR - ZigZag Alerts is a cTrader indicator designed for precise price swing analysis. It identifies and plots key swing points such as Higher Highs, Higher Lows, and Lower Lows, maintaining consistent ZigZag lines across all symbols, timeframes, and price ranges. The indicator calculates Fibonacci retracement and expansion levels by comparing swings, aiding in identifying potential entry and exit points.
Key features include adjustable sensitivity for swing detection tailored to market conditions, customizable label formats (abbreviated or full), and font and color settings to distinguish bullish and bearish swings. Swing labels display corresponding prices for enhanced clarity. Alert management options allow users to pause alerts instantly, add custom comments for easy identification, and receive notifications via sound, pop-ups, Telegram, or email. Alerts can be configured for specific swing types and Fibonacci levels, with the ability to pause alerts temporarily.
A user guide is accessible directly from the chart for quick reference. This indicator supports traders in monitoring market swings and Fibonacci levels with customizable alerts to facilitate informed trading decisions.
Indicator profile
Customer reviews
4.3
Reviews: 3
5 | 33 % | |
4 | 67 % | |
3 | 0 % | |
2 | 0 % | |
1 | 0 % |
Customer reviews
February 15, 2025
Simple but not useless around swing point analysis. The useful part is reviewing reversals, pullbacks and swing zones, with the numbers checked before scaling. I would test 20 swing signals and ignore setups where the stop is wider than the 1.5R target. The level is useful when it supports the market story.
February 14, 2025
February 14, 2025
Fair pick for discipline if the trader wants it helps identify turning points and cleaner structure. It works best as support, not a final decision maker. Swing points look better after 3 pivots, especially when the 0.5 Fib area agrees with structure. the signal still needs broader context.
Discussion
FAQ
Forex
Products available through cTrader Store, including trading bots, indicators and plugins, are provided by third-party developers and made available for informational and technical access purposes only. cTrader Store is not a broker and does not provide investment advice, personal recommendations or any guarantee of future performance.


Price
231
Sales
692
Free installs