
BSL_SSL_Liqudity
Indicator
7 purchases
Version 1.0, Aug 2025
Windows, Mac
4.3
Reviews: 3
Description
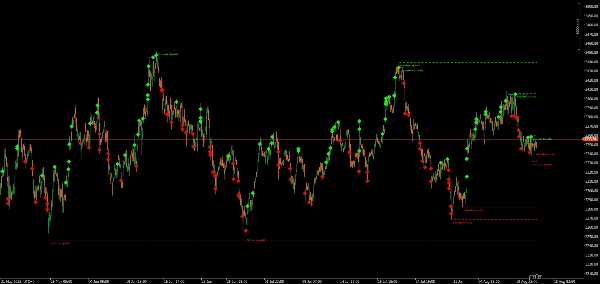
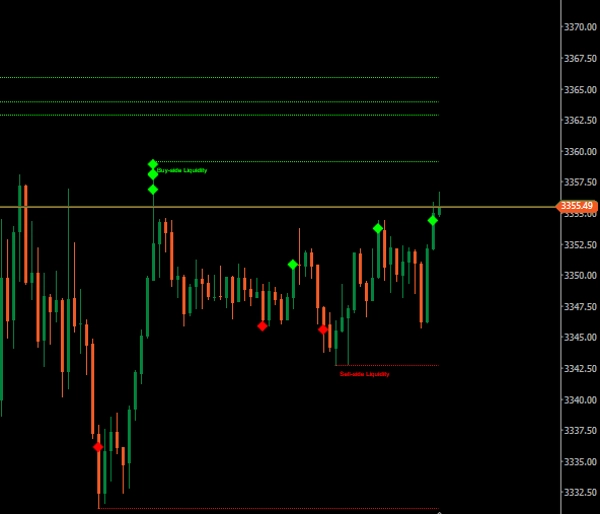
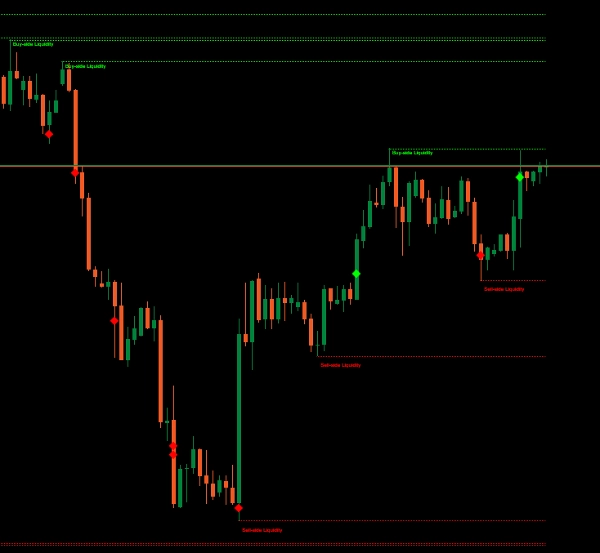
The Buy-Side & Sell-Side Liquidity (BSL/SSL) Indicator is designed for traders who follow (ICT) or liquidity-based strategies. It automatically detects key liquidity zones in the market—highlighting swing highs (Buy-Side Liquidity) and swing lows (Sell-Side Liquidity)—and monitors whether these levels have been swept or remain intact.
- BSL (Buy-Side Liquidity) – Marks recent swing highs where stop-loss orders from short positions or breakout buy orders may be clustered.
- SSL (Sell-Side Liquidity) – Marks recent swing lows where stop-loss orders from long positions or breakout sell orders may be sitting.
- Swept Markers – When price breaches a marked liquidity level, the indicator plots a diamond marker to show the sweep.
Who Is It For?
- ICT Methodology Traders
- Liquidity Grab / Stop Hunt Strategists
- Scalpers & Day Traders targeting session-based moves
- Swing Traders looking for high-probability reversal points
Benefits
- Visual clarity – Instantly see where the market is likely to seek liquidity.
- Time efficiency – No more manually marking swings and checking for sweeps.
- Strategic advantage – Combine with
- FVGs,
- market structure to refine trade setups.
- Session kill zones
- macros
My Other Products
- Institutional FVG Zones MTF with Confluence
- All-in-One Session Levels Suite
- MARKET_STRUCTURE BOS_CHoCH
- Multi_TF Candlestick Chart Overlay
- ICT Killzones & Macros
- ICT_SMC_ToolKit
- VWAP_MTF
- Traders Dynamic Index (TDI)
- Market_Session_Forex
Disclaimer: Trading involves risk, and past results do not guarantee future performance. Use proper risk management, follow stop-loss levels, and trade responsibly. I am not liable for any financial losses from using these algorithms.use these indicators for your confluence and reduce burden your charting markup time
Summary
AI summary
The Buy-Side & Sell-Side Liquidity (BSL/SSL) Indicator identifies key liquidity zones in the market by marking recent swing highs (Buy-Side Liquidity) and swing lows (Sell-Side Liquidity). It highlights areas where stop-loss orders or breakout orders may cluster and tracks whether these liquidity levels have been breached, displaying diamond markers to indicate sweeps. Designed for traders using ICT methodology, liquidity grab, or stop hunt strategies, it supports scalpers, day traders, and swing traders targeting session-based moves or high-probability reversal points. The indicator provides visual clarity by automatically marking liquidity zones, saving time otherwise spent manually identifying swings and sweeps. It can be combined with other tools such as Fair Value Gaps (FVGs), market structure analysis, and session kill zones to refine trade setups. Supported markets include Forex, indices, commodities, and popular symbols like BTCUSD, EURUSD, XAUUSD, and NAS100. The indicator aims to enhance strategic decision-making by clearly displaying where the market is likely to seek liquidity.
Indicator profile
Customer reviews
4.3
Reviews: 3
5 | 33 % | |
4 | 67 % | |
3 | 0 % | |
2 | 0 % | |
1 | 0 % |
Customer reviews
August 16, 2025
Practical account helper around smart money style analysis. The useful part is mapping zones before entries, with the numbers checked before scaling. A good sample is 20 FVG or order block reactions, with messy 0.705 areas skipped. The zone is more convincing when structure and risk both make sense.
August 15, 2025
August 15, 2025
Clean trading note if the trader wants it adds structure around liquidity, gaps and market shifts. It works best as support, not a final decision maker. For SMC logic, I trust zones more when 0.5 mitigation, BOS and liquidity sweep line up. zones still need manual validation.
Discussion
FAQ
BTCUSD
Forex
Indices
EURUSD
Commodities
XAUUSD
NAS100
Products available through cTrader Store, including trading bots, indicators and plugins, are provided by third-party developers and made available for informational and technical access purposes only. cTrader Store is not a broker and does not provide investment advice, personal recommendations or any guarantee of future performance.


Price
Since 22/06/2025
80
Sales
84
Free installs