
Description
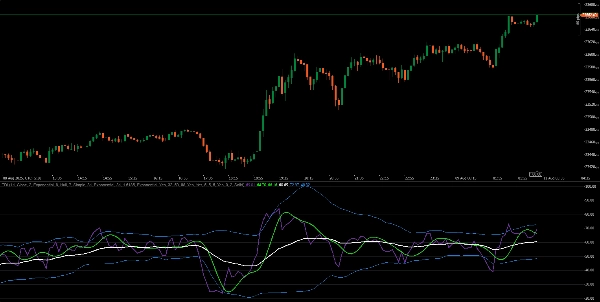
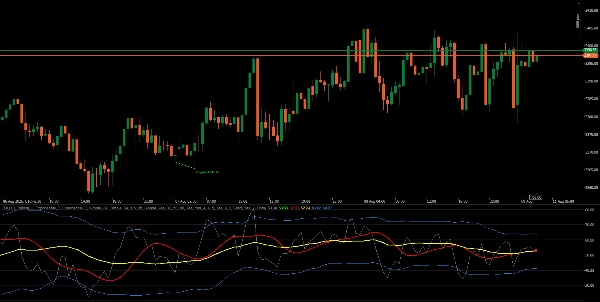
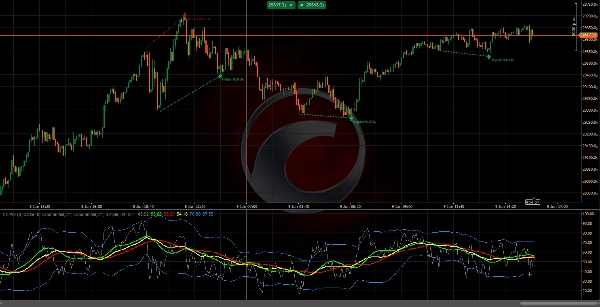
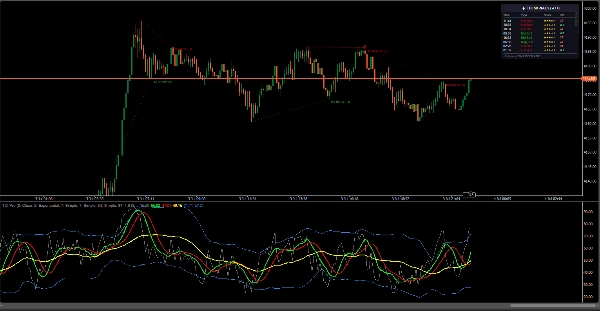
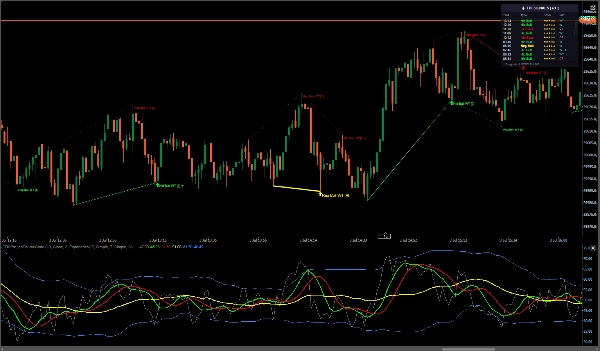
A professional TDI - combines RSI, moving-average smoothing, and Bollinger Bands with automatic Regular & Hidden divergence detection. Draws divergence lines in the TDI pane and (optionally) on the price chart for crystal-clear context.
The divergence engine skips live bars and validates pivots only after full confirmation. Market State Filtering suppresses low-quality signals during ranging conditions, while Strength Scoring ranks every setup using multiple confluence factors including Bollinger Band extremes, trend alignment, Market Base Line slope, pivot quality, and TDI cross proximity.
- Full TDI suite: Price Line (green), Signal Line (red), Market Base Line (yellow), RSI bands.
- Volatility Bands: Bollinger Bands applied to RSI (period & deviations configurable).
- Divergence engine: Detects Regular (reversal) and Hidden (trend-continuation) divergences.
- On-chart visuals: Toggle to draw divergence lines/labels directly on the price chart.
- Precision pivots: User-controlled swing pivots (Left/Right bars) + minimum bar spacing.
Key Features
- No-Repaint Architecture
- Market State Filter
- Bollinger Band Confluence ★
- Strength Score (1–5)
- Visual Signal Priority
- Trend Alignment (WT / CT)
Change log
- v1.0 – Initial release: full TDI + Regular/Hidden divergence detection, on-chart drawing, guide levels, rich styling controls.
My Other Products
- Institutional FVG Zones MTF with Confluence
- All-in-One Session Levels Suite
- MARKET_STRUCTURE BOS_CHoCH
- Multi_TF Candlestick Chart Overlay
- ICT Killzones & Macros
- ICT_SMC_ToolKit
- VWAP_MTF
- Traders Dynamic Index (TDI)
- Market_Session_Forex
Disclaimer: Trading involves risk, and past results do not guarantee future performance. Use proper risk management, follow stop-loss levels, and trade responsibly. I am not liable for any financial losses from using these algorithms. use these indicators for your confluence and reduce burden your charting markup time
Summary
The indicator employs a no-repaint architecture and validates swing pivots only after full confirmation, skipping live bars to ensure signal reliability. It includes a Market State Filter to suppress low-quality signals during ranging markets and a Strength Scoring system (1–5) that ranks setups based on multiple confluence factors such as Bollinger Band extremes, trend alignment, Market Base Line slope, pivot quality, and proximity of TDI crosses.
Key components of the full TDI suite include the Price Line (green), Signal Line (red), Market Base Line (yellow), and RSI bands. Users can control precision pivots with adjustable swing pivot parameters and minimum bar spacing. Visual signal priority and trend alignment features support clearer interpretation of market conditions. The indicator supports multiple symbols including BTCUSD, EURUSD, and GBPUSD, and is designed for use with bar and tick data.
Customer reviews
5 | 67 % | |
4 | 0 % | |
3 | 33 % | |
2 | 0 % | |
1 | 0 % |


