Multi_TF Candlestick Chart Overlay
"Multi_TF Candlestick Chart Overlay" logo
21/08/2025
1
Desktop
Since 22/06/2025
Sales
15
Free installs
13
"Multi_TF Candlestick Chart Overlay" uploaded image

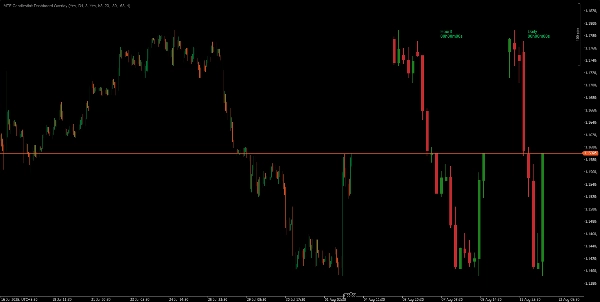
This indicator overlays bold, easy-to-read candlestick panels from two higher timeframes—fully configurable—directly on your chart. Instantly visualize higher timeframe market structure, trend, and momentum without switching charts.

Features:
• Display two customizable panels (any timeframes) side-by-side
• Real-time countdown timer for each TF’s next candle
• Clean, filled candles with bull/bear coloring and bold wicks
• User controls for panel position, size, spacing, and candle count
• Zero lag, works on any chart timeframe or symbol

Perfect for traders who demand a clear overview of multiple timeframes at a glance.

Never miss a key HTF structure shift again—see the big picture right on your trading chart!


My Other Products


Disclaimer: Trading involves risk, and past results do not guarantee future performance. Use proper risk management, follow stop-loss levels, and trade responsibly. I am not liable for any financial losses from using these algorithms.use these indicators for your confluence and reduce burden your charting markup time

0.0
Reviews: 0
Customer reviews
No reviews for this product yet. Already tried it? Be the first to tell others!
More from this author
Tiny_Aim_Trainer
trading stress-relief “mini-game”
Indicator
NAS100
XAUUSD
Commodities
+10
MARKET_STRUCTURE BOS_CHoCH
MarketStructurePro – Smart BOS/CHoCH
Retro_Shooting_Game
trading stress-relief “mini-game”
Indicator
Indices
Commodities
Forex
Institutional FVG Zones MTF with Confluence
Professional Fair Value Gaps with multitimeframe spot on
Market_Session_Forex
Market Sessions
Indicator
NAS100
Indices
XAUUSD
+4
BSL_SSL_Liqudity
Buy-Side & Sell-Side Liquidity (BSL/SSL) Indicator
Indicator
VWAP
Breakout
Scalping
VWAP & Sessions & D,W,M HLO Levels
Killzone Session With VWAP – Precision Meets Price Action
TDI_Pro
Traders Dynamic Index (TDI) — Divergence Edition
Indicator
NAS100
XAUUSD
FVG
+11
Fair Value Gaps_FVG_MTF
Multi-TF FVG + Smart Fibonacci
VWAP_MTF
📊 VWAP with MTF & Dynamic Deviation Bands
ICT Killzones & Macros
KILLZONES AND MACRO SESSIONS
Indicator
NAS100
Indices
Breakout
+6
All-in-One Session Levels Suite
Institutional Session Levels Pro OHLC,Prev(D,W,M OHLC)
Indicator
NAS100
Indices
Prop
+6
ICT_SMC_ToolKit
institutional-level market analysis
You may also like
Indicator
XAUUSD
Commodities
True Open Pivot Levels
This indicatorFull Description: Th shows the open price lines at key market times based on Eastern Standard Time (EST).
Indicator
Indices
Forex
USDJPY
Yen Index w HMA
Yen Index
Reversal Probability Engine
Detecting reversal zones + multidimensional mapping of support and resistance "Golden Levels.
Indicator
Indices
RSI
Prop
+4
SuperEmaColorRSI
This is a super indicator that integrates the RSI indicator with a dual moving average system.
Chaikin Money Flow
Chaikin money flow's primary purpose is to distinguish between periods of accumulation and distribution of a security.
Indicator
Indices
Stocks
Forex
+1
TwoSMA.cs
An indicator that accurately shows the trend direction. A vital tool for clear trading decisions.
Indicator
Prop
Forex
MM-Symbol Info (Pro)
NEW - PNLs as % - daily, weekly, monthly, or yearly & Spread, Time To Close, PNL Alerts, custom Bid / Ask lines
Big Candel
1 Candel High Time Freme
PVA Volume+Analysis_noSourceCode
PVA Volume Analysis Indicator:Price volume over trend strength and direction
Indicator
NZDUSD
XAUUSD
Stocks
+7
Signals Volatility Cloud Breakout
🎯Generate precise BUY/SELL signals. 📈🎯 Tracks trends with colored candles & clouds.
Indicator
ATR
Stocks
Forex
+2
Order_Block_Arrow_
Order Block - Market Structure Signals - This is one of the main indicators in the Market Structure trading system
IR Ichimoku Macd
this indicaotr show distance between Tenkan to Kijun, Close to Kijun and Close to Tenkan 
Indicator
NAS100
NZDUSD
RSI
+11
Pattern Signal Forex
Indicator pattern signal moment
ICT MACRO THEORY
Are essentially short intervals during which the algorithm seeks liquidity or adjusts price.....
Top-rated
Free
FairValueGap
This Fair Value Gap (FVG) indicator is a technical analysis tool used to identify potential price imbalances.
Indicator
RSI
Breakout
XAUUSD
+5
Dynamic Range MomentumI
This histogram helps visualize the strength and direction of market movements, making it easier to spot potential trends
LT_FairValueGap
Detects valid Fair Value Gaps from strong 3-bar patterns. Keep drawing unfilled gaps until price fills them.
Ctreder Smart SMA Indicator
cTreder Smart SMA