
ICT Killzones & Macros
Indicator
1 purchases
Version 1.0, Jul 2025
Windows, Mac
5.0
Reviews: 1
Description
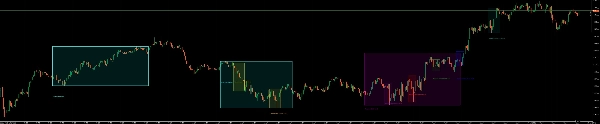
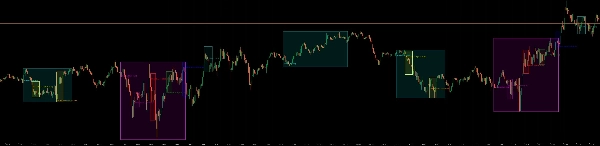
This advanced cTrader indicator plots key market session zones based on ICT (Inner Circle Trader) concepts, fully aligned.
- 🔹 Asia, London, and New York Killzone Sessions
- 🔹 Macro Sessions: London and New York AM/PM micro windows
- 🔹 Smart Labels with offset and styling
Ideal for Smart Money Traders and ICT-based price action strategies, this tool helps identify high-probability trade setups by visualizing institutional timing and confluence zones.
My Other Products
- Institutional FVG Zones MTF with Confluence
- All-in-One Session Levels Suite
- MARKET_STRUCTURE BOS_CHoCH
- Multi_TF Candlestick Chart Overlay
- ICT Killzones & Macros
- ICT_SMC_ToolKit
- VWAP_MTF
- Traders Dynamic Index (TDI)
- Market_Session_Forex
Disclaimer: Trading involves risk, and past results do not guarantee future performance. Use proper risk management, follow stop-loss levels, and trade responsibly.use these indicators for your confluence and reduce burden your charting markup time
Summary
AI summary
ICT Killzones & Macros is an advanced cTrader indicator designed to plot key market session zones based on Inner Circle Trader (ICT) concepts. It visually highlights the Asia, London, and New York Killzone sessions, as well as macro sessions including London and New York AM/PM micro windows. The indicator features smart labels with customizable offset and styling to enhance chart readability. It is intended for traders employing Smart Money Concepts (SMC) and ICT-based price action strategies, helping to identify high-probability trade setups by visualizing institutional timing and confluence zones. Supported markets include Forex, indices, and commodities, with specific symbols such as EURUSD, GBPUSD, NZDUSD, XAUUSD, and NAS100. The tool aims to reduce chart markup time by providing clear session delineations aligned with institutional trading hours.
Indicator profile
Customer reviews
5.0
Reviews: 1
5 | 100 % | |
4 | 0 % | |
3 | 0 % | |
2 | 0 % | |
1 | 0 % |
Customer reviews
Discussion
FAQ
Prop
Forex
Indices
EURUSD
Commodities
GBPUSD
NZDUSD
SMC
XAUUSD
NAS100
Products available through cTrader Store, including trading bots, indicators and plugins, are provided by third-party developers and made available for informational and technical access purposes only. cTrader Store is not a broker and does not provide investment advice, personal recommendations or any guarantee of future performance.


Price
Since 22/06/2025
82
Sales
87
Free installs