
Description
Volatility Breakout Indicator - Hawkes Volatility Engine
This indicator is meant to provide context, not immediate trading actions. The volatility component helps you know when market conditions are changing - periods of low volatility often precede big moves, and high volatility periods eventually exhaust themselves. The EWMA component keeps you oriented with the developing trend and highlights when price stretches away from it.
Combine these two perspectives - volatility regime and trend context - with your own trading methodology and judgment. The indicator shows you the environment - you decide what to do in it.
Version 2.0
Open for future updates
-----------------------------------------------------------------------------------------------------------------------------------------------------------------------
Overview
-----------------------------------------------------------------------------------------------------------------------------------------------------------------------
This indicator combines two distinct components to help traders identify volatility regimes and trend conditions simultaneously.
The first component uses a Hawkes Process to detect changes in market volatility. Unlike traditional volatility indicators, it doesn't predict direction—it simply signals when the market is transitioning from quiet compression to active volatility, or vice versa. Think of it as a volatility state detector: it tells you when things are heating up or cooling down, but not which way price will move.
The second component adds a dual EWMA (Exponentially Weighted Moving Average) system that overlays on your price chart. This gives you trend context using a fast and slow moving average crossover, with an added layer of candle coloring to show when price diverges from the trend.
-----------------------------------------------------------------------------------------------------------------------------------------------------------------------
How it workes
-----------------------------------------------------------------------------------------------------------------------------------------------------------------------
Volatility Detection: The indicator uses Parkinson's High-Low Volatility estimator—a more efficient method than standard ATR because it uses the full bar range. This normalized volatility feeds into a Hawkes Process calculation, which is then compared against dynamic quantile-based thresholds.
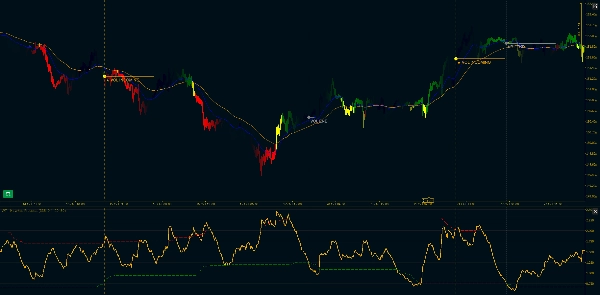
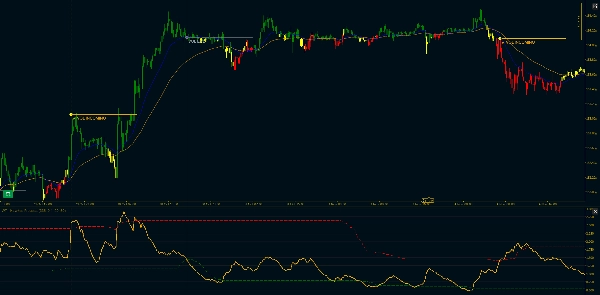
When volatility breaks above the upper threshold after a period of compression, you get a "VOL INCOMING" signal. When it drops back below the lower threshold, you see "VOL END". These aren't entry signals—they're volatility regime changes. The market is either waking up or going to sleep.
Trend Context: Two exponentially weighted moving averages (Fast and Slow) appear on your main chart. The Fast MA is blue, Slow MA is orange. When Fast is above Slow, the trend is up. When Fast is below Slow, the trend is down.
The Divergence Filter: Here's where it gets interesting. Sometimes price pulls away from the trend significantly. When the entire candle (open, high, low, close) is below the Fast MA during an uptrend, or above it during a downtrend, the bar turns yellow. This is a strict filter—if even the wick touches the Fast MA, it stays with the normal trend color.
Yellow bars often appear at retracements or exhaustion points, but remember: they don't tell you what comes next, just that price has temporarily separated from the trend line.
-----------------------------------------------------------------------------------------------------------------------------------------------------------------------
Key Features
-----------------------------------------------------------------------------------------------------------------------------------------------------------------------
Volatility Component:
- Parkinson High-Low Volatility normalization (more efficient than standard ATR method)
- Hawkes Process calculation with adjustable decay (Kappa parameter)
- Dynamic quantile-based thresholds (customizable percentiles)
- Visual markers: "VOL INCOMING" at volatility breakouts, "VOL END" at compressions
- Continuation filtering: only the first breakout gets marked, not every spike
- Optional horizontal trendlines and vertical markers
EWMA Trend Component:
- Pandas-compatible EWMA calculation (adjust=True formula)
- Fast and Slow MA lines displayed on main price chart
- Customizable span lengths (default: 20/50)
- Min periods support (suppresses output until sufficient data)
- Ignore NA option for handling gaps
- Three-color candle system: Green (uptrend), Red (downtrend), Yellow (divergence)
Customization Options:
- Parkinson Period (lookback for volatility calculation)
- Hawkes Kappa (decay rate, affects sensitivity)
- Quantile Lookback Period
- Low and High Volatility Thresholds (percentiles)
- Annualization toggle and segment length
- Fast and Slow Span for moving averages
- Bullish, Bearish, and Divergence colors
- Trendline extension length
- Show/hide vertical markers
----------------------------------------------------------------------------------------------------------------------------------------------------------------------------
Technical Note: The Hawkes Process component uses a recursive exponential calculation optimized for real-time use. The EWMA implementation matches Pandas behavior for consistency with Python-based backtesting. Both components calculate only on closed bars to avoid repainting.
Summary
Customer reviews
5 | 100 % | |
4 | 0 % | |
3 | 0 % | |
2 | 0 % | |
1 | 0 % |


