
Description
TIB — Tick Imbalance Bars Indicator. Detect Market Information Before Price Moves
Version 2.0
Use Comments Section to ask for more details
Available for Video Session with Setup Guide after Purchase
Tick Imbalance Bars brings institutional-grade market microstructure analysis to cTrader. Based on the groundbreaking research of Marcos López de Prado, as detailed in his book Advances in Financial Machine Learning, this indicator samples price data not by time or volume — but by information arrival.
The Core Insight
Traditional bars (time, tick, volume) sample markets uniformly, missing critical moments when informed traders act. Tick Imbalance Bars solve this by detecting when buying or selling pressure exceeds expected levels — signaling the presence of informed traders and potential price movement before the market reaches equilibrium.
How It Works
The indicator applies the tick rule to classify each trade as buying (+1) or selling (-1) pressure. It then accumulates these signed ticks until the cumulative imbalance (θT) exceeds a dynamic threshold calculated using an Exponentially Weighted Moving Average (EWMA). This expected threshold adapts to market conditions by analyzing the historical probability of buy vs. sell ticks. When the threshold is breached, a new TIB bar is created — each bar containing approximately equal amounts of market information, regardless of volume or time elapsed.
Key Features
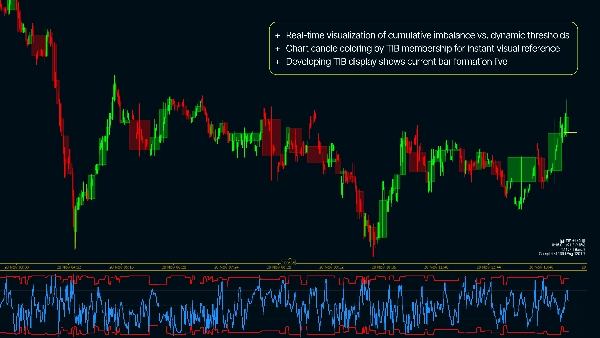
- Real-time visualization of cumulative imbalance vs. dynamic thresholds
- Chart candle coloring by TIB membership for instant visual reference
- Developing TIB display shows current bar formation live
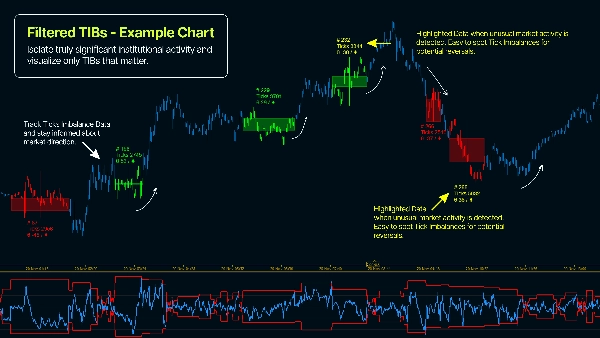
- Min Ticks Filter to display only statistically significant bars
- Fully configurable Expected Bar Size and EWMA parameters
- Dashboard metrics tracking imbalance intensity and information density
Why Use Tick Imbalance Bars?
- Sample more frequently during high-information periods — capturing actionable volatility
- Detect informed trading activity before price equilibrium is reached
- Reduce noise from uninformed market participants and retail order flow
- Achieve better statistical properties (IID Gaussian-like returns) than time-based sampling
- Apply proven quantitative finance methodology used by institutional traders
- Identify asymmetric information in order flow — a proven predictor of price direction
Practical Setup Guide for Base Configuration ( ! )
- Apply the indicator on 1minute timeframe ( or lower - use tick-based charts )
- E[T] - Input Expected Ticks per bar for sampling ( start with 1000 )
- EWMA Alpha - [ 0,001 - 0,5 ], where 0,001 will produce most stable results ( in theory ) while 0,5 will produce TIBs based on more recent data
- Initial Imbalance - recomended 0,5 but you can experiment ( 0,5 = netural imbalance at initialization )
Summary
The indicator classifies each trade as buying (+1) or selling (-1) pressure using the tick rule and accumulates these signed ticks until a dynamic threshold—calculated via an Exponentially Weighted Moving Average (EWMA)—is exceeded. When this threshold is breached, a new Tick Imbalance Bar (TIB) is formed, each containing roughly equal market information regardless of elapsed time or volume.
Key features include real-time visualization of cumulative imbalance versus dynamic thresholds, candle coloring by TIB membership, live display of the developing bar, a minimum ticks filter for statistical significance, configurable expected bar size and EWMA parameters, and dashboard metrics tracking imbalance intensity and information density.
This approach enables more frequent sampling during high-information periods, reduces noise from uninformed trades, and provides better statistical properties than time-based sampling. It supports markets including Forex, indices, and cryptocurrencies, and is suitable for strategies such as scalping and breakout trading.
Customer reviews
5 | 100 % | |
4 | 0 % | |
3 | 0 % | |
2 | 0 % | |
1 | 0 % |


