
Description
1. What Hyper Trend is and who it's for
Hyper Trend is a trend-following overlay indicator for c Trader. It gives you a single, easy-to-read trailing trend line, a reference zone for joining that trend, clear signal markers, optional on-chart stop-loss / take-profit framing, and an interactive panel so you can adjust most of what you see live, without reopening settings.
The design goal is deliberately simple: take well-established trading methods and output trends and signals that are genuinely easy to read — then make the whole thing lightweight, non-intrusive, and quick to set up.
It's suitable for every kind of trader, regardless of experience.
- Beginners get a clean read on direction and risk.
- Experienced traders get a fast, configurable overlay that stays out of the way of their own price reading.
It's built to be simple and efficient on the surface while grounded in researched applications underneath, and easy to set up and fine-tune.
"Whatever you trade and however experienced you are, Hyper Trend is meant to be easy to read, easy to set up, and easy to fine-tune."
2. The idea behind it
Moving averages, ATR, Super Trend, smoothing filters — these are well-known, established
methods, and they exist precisely to do what Hyper Trend does: turn raw price into a readable
trend with usable signals.
So why another tool? Because in practice, most indicators in this space share the same
problems:
- Repackaging. A great deal of what's published is the same or old logic, renamed and
re-released over and over, with little genuinely new underneath. - Chart Clutter. Many pile so much onto the chart that reading price itself becomes almost
impossible, and their internal logic sometimes works against the trader's actual
intention. - Fading edge. The underlying concepts sound good, but in today's fast-developing
markets — especially on faster timeframes — they often fail to hold any real edge.
- Repackaging. A great deal of what's published is the same or old logic, renamed and
Hyper Trend's premise is to push against all three. It keeps the established backbone (smoothing,
volatility bands, Super Trend-style direction) but applies newer approaches to data
pre-processing, price smoothing, and signal handling — the kind of techniques discussed
in scientific papers, trading journals, and academic researches. All reference links can be found in video description.
SOURCE REFERENCES
- ECB: A TREND-CYCLE(-SEASON) FILTER
- Kalman filter demystified: from intuition to probabilistic graphical model to real case in financial markets
- Financial Pricing Models in Continuous Time and Kalman Filtering
- The Holt-Winters filter and the one-sided HP filter: A close correspondence
- A Bayesian Framework for Trend and Seasonality Decomposition
- Hedge Fund Returns, Kalman Filter, and Errors-in-Variables
- Moving Averages for Financial Data Smoothing
- Optimizing the Performance of the Fractal Adaptive Moving Average Strategy: The Case of EUR/USD
- Kalman Filter and Optimal Smoothing Derived by the Regression Model
The purpose is to test a simple question in practice: can these theoretical concepts,
applied on top of established tools, bring real edge back in the trader's favor? Hyper Trend is
one concrete example of that attempt — established methods, modernized where it counts, with
readability treated as a first-class feature rather than an afterthought.
"Same trusted foundations — averaging, volatility, trend logic — but with
modern pre-processing and a relentless focus on keeping the chart readable."
3. Key points — what makes it different
A non-intrusive overlay, by design. It keeps a deliberate balance between showing what's genuinely useful on top of price and not distorting the price flow you're reading.
Optimized for c Trader — fast and light. It's engineered for fast loading and low CPU usage, and designed to run smooth even with multiple instances attached and running at the same time, across several charts or symbols, so your platform stays responsive.
A clean pipeline under the hood.
- Pick a price source. You choose which price the calculation runs on — close, a
midpoint like HL2, a typical price like HLC3, and so on (the source setting). - Optional pre-processing. You can route that price through Heikin-Ashi candles
and/or a Kalman filter before anything else, to smooth noisy series — this is part of
the "modernized processing" idea. - Smoothed trend basis. The chosen source is smoothed to form the trend basis the rest
of the logic builds on — designed to track the dominant move. - Volatility bands. A Wilder-smoothed ATR sets a band above and below that basis.
- SuperTrend logic. Standard SuperTrend "stickiness" then decides which side is active:
in an uptrend the lower band becomes the trailing line; in a downtrend the upper band
does. When price closes through the active band, the trend flips.
- Pick a price source. You choose which price the calculation runs on — close, a
"It's built to sit lightly on the chart — show you what helps, hide what
doesn't, and never get in the way of the price itself. One click on the panel takes you back to
clean price whenever you want it."
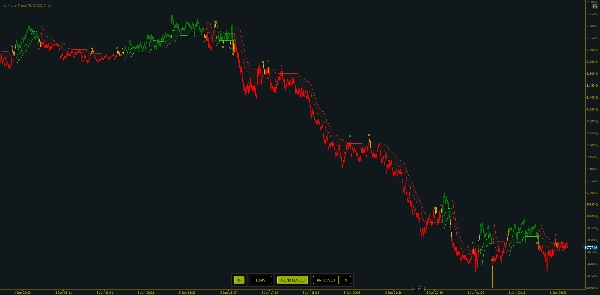
4. Reading the chart — the core visuals
1. The trailing line
- Green = uptrend (line beneath price)
- Red = downtrend (line above price)
- A color change is a trend switch
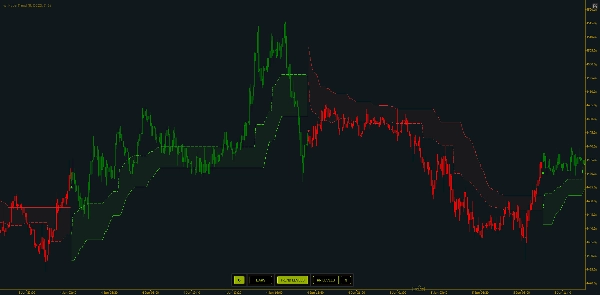
2. Entry zones
- When enabled, a dotted level sits a fraction of the way from the trailing line toward the opposite band — a "pullback into value" reference inside the current trend, rather than chasing the extreme.
Entry Zone Distancecontrols how far it sits.
3. Bar coloring
- Bars can be colored based on the active direction, with three styles:
- Regular (bull/bear by direction),
- Mode 1, provides a different visualization in the transition phases
- Mode 2, which additionally marks neutral transitional bars.
The visible green/red trailing line is the final output. Everything else — entry
zones, markers, SL/TP lines, bar coloring — is layered on top of the same direction state.
"The color of the line is your regime bias at a glance; the dotted zone is where the trend offers a more reasonable entry."
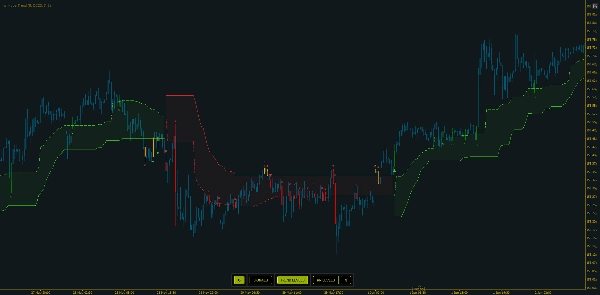
5. Signals and Alerts
Hyper Trend distinguishes three signal types. Each signal prints a labeled marker at the confirmed bar and it is independently toggleable:
- Switch signals (on by default) — triggered when the trend switch direction ( or bias ). This is the primary signal.
- Cross entry signals — triggered on a validated round-trip cross of the entry zone within an existing trend (price leaves and reclaims the zone). For timing pullback entries.
- Cross trend signals — triggered on a validated round-trip cross of the trailing line itself. In the richer coloring mode, a trend-line cross on a transitional/neutral bar is treated as an exit-style marker rather than a new entry.
- Exit signals — visible when Bar Coloring - Mode 2 is enabled, these signals can aid in signaling when a trend is losing it's strength and a couple of bars before the switch signals. These are useful to spot periods of low volatility with decreased market participation which produce chopped or range-bound price action.
Alerts: when enabled, Hyper Trend plays a chosen sound and shows a popup for each detected signals. Alerts follow the same toggles — only the signal types you've switched on will alert — and the on-chart panel's alert button enables/disables them live. The popup is concise: symbol and timeframe, the signal type and direction, and the current price.
"Start with just the switch signal for a clean chart, then layer in the cross signals when you want finer entry timing. Each one can ping you with a sound and a popup."
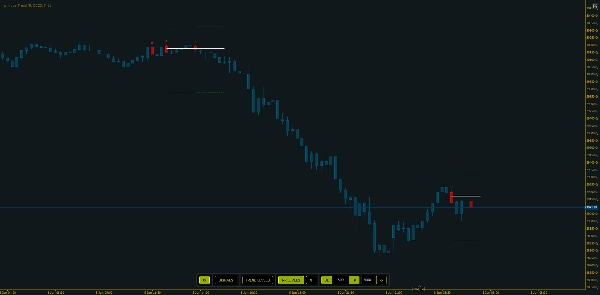
6. Plan your trades — Risk / Reward levels on the chart
With Stoploss / Target levels on, every signal bar gets three short horizontal lines: an Entry line at the signal bar's mid price, an SL line a fixed pip distance on the losing side, and a TP line a fixed pip distance on the winning side.
Levels are pre-extended by a fixed number of bars and don't keep growing afterward — a snapshot at the signal. A new signal truncates the previous set so levels don't bleed together. Entry, SL, and TP each have their own color, with adjustable line widths and styles.
"It frames the trade visually — entry, stop, target — so you see the risk-reward before you commit, then keeps the chart tidy by limiting how many sets linger."
7. The interactive panel — change visuals live
The on-chart panel changes what's displayed immediately, without reopening parameters.
Active toggles are highlighted; the panel always reflects current state. You have multiple options for placing it on chart, or hide it entirely.
"Everything you'd normally dig into settings for — coloring, trend levels, risk lines, and the SL/TP distances — is one click on the panel. Type new distances, hit refresh, and the levels update."
8. Trading approaches — a few examples
Approach A — Trade the switch (trend-following). Use switch signals as your primary cue: enter in the new direction on a confirmed flip, and treat the trailing line as your visual invalidation. A flip back to the opposite color is the exit/reverse. Simplest, cleanest read.
Approach B — Pullback entry inside a trend. With the trend already established, wait for price to pull back into the entry zone and turn on cross-entry signals so the re-cross marks the moment price reclaims the zone — joining the trend at better value instead of chasing the extreme.
Approach C — Framed risk on every setup. Turn on RR Levels, set SL / TP distances that match the symbol's volatility. You see the entry / stop / target before committing, and manage your trade accordingly.
Across all three, the common thread is judgment: act in the direction of the trend, confirm with surrounding price action, and use the line as your reference — Hyper Trend is the read, you place and manage the trade.
"Trade the flip, or wait for the pullback into the zone, or frame every setup with the risk lines — pick the approach that fits how you trade. Understand market context and combine it with other tools like RSI or MACD, spot divergences. That combination is where it earns its keep."
9. How to evaluate it
Practical checks: scroll back through history and see whether the trend line kept you on the right side of sustained moves and where flips clustered; compare two settings side by side (e.g. different ATR multiplier or trend lookback) to see the responsiveness-vs-smoothness trade-off; review the SL/TP frames historically to gauge how often the target was reached before the stop at your chosen distances; match it to a market (clearly trending vs. tightly ranging); and mind the clock — it identifies its best regimes while the market is actually moving, so compare active hours with quiet, off-peak periods.
"Evaluate it by scrolling history and comparing settings — how clean are the flips, how well does the entry zone time pullbacks, and how do the SL/TP frames resolve?"
10. Limitations & other notes
Hyper Trend is built to be above the quality of generic, repackaged indicators — but it's a tool, not a crystal ball:
- It can still produce false signals. Acting on every signal mechanically will not produce positive outcomes on its own.
- It rewards skill and context. It assumes a basic ability to read price and a sense of the surrounding market. Combined with that context and sound money management, it becomes a genuinely powerful tool — and that combination is what tends to produce positive results over the longer term.
- It's best when the market moves. Readings taken in quiet periods, or completely outside regular trading hours, lose some of that quality.
- Trend tools lag and whipsaw. Like any SuperTrend-style approach, flips can come late on reversals and cluster in ranges; the smoothing and ATR band reduce this but don't remove it.
- SL/TP lines are a planning aid, not a guarantee. Fixed-pip references from the signal bar's midpoint; they don't account for spread, slippage, or your actual fill, and they don't trail.
"Bring basic price reading, market context, and money management, and it becomes genuinely powerful over the long run — strongest when the market is moving."
HyperTrend delivered as a clean, non-intrusive overlay with built-in entry timing, clear signals, on-chart risk framing, and a live control panel. Simple to use, light on cTrader, and meant for any trader, on any symbol or timeframe.
"Simple to set up, light to run, and built to help any trader read trend, sport entries and exits, and frame risk — kept clean and readable."
Summary
Under the hood, HyperTrend processes price data through selectable sources and optional smoothing filters such as Heikin-Ashi and Kalman filters. It applies volatility bands based on ATR and SuperTrend logic to determine active trend direction. The indicator offers three types of signals—trend switches, entry zone crosses, and trailing line crosses—with labeled markers and optional alerts via sound and popups.
Risk management is supported through on-chart stop-loss and take-profit levels displayed as horizontal lines at fixed pip distances from entry points, helping traders visualize risk/reward before committing. An interactive on-chart panel allows live adjustment of visual settings and parameters without reopening menus.
HyperTrend is optimized for fast, low-CPU performance on cTrader, suitable for all trader experience levels, and applicable across symbols and timeframes. It emphasizes readability and simplicity while incorporating modern data processing techniques to enhance traditional trend-following methods.


