Session Power Model
Indicator
Version 1.0, Jul 2026
Windows, Mac
Trading product for Session Power Model Indicator Liquidity Sweep Market Structure, image 2
Trading product for Session Power Model Indicator Liquidity Sweep Market Structure, image 3
Trading product for Session Power Model Indicator Liquidity Sweep Market Structure, image 4
Trading product for Session Power Model Indicator Liquidity Sweep Market Structure, image 5
Since 07/10/2025
2
Sales

Description

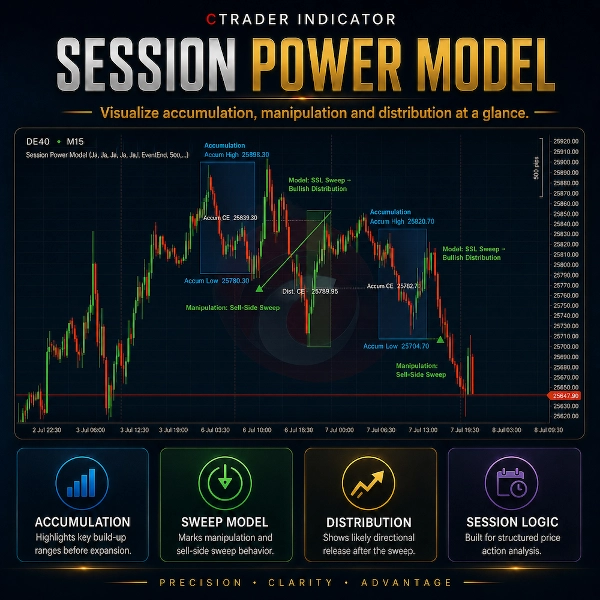
Session Power Model is a visual cTrader indicator designed to help traders analyze recurring session behavior directly on the chart.


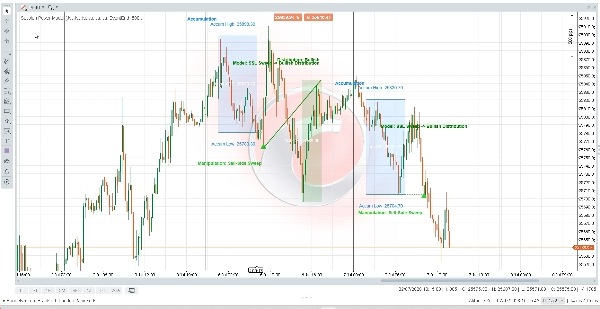
The indicator divides the trading day into three configurable phases: accumulation, manipulation and distribution. It marks the accumulation range, detects potential liquidity sweeps during the manipulation window and visualizes the following distribution phase.


The model can identify sell-side sweeps leading into a bullish distribution context, buy-side sweeps leading into a bearish distribution context, and mixed days where both sides are swept.


Main features:

- Accumulation range visualization

- Manipulation sweep detection

- Bullish and bearish distribution phase display

- Session CE lines

- Sweep arrows

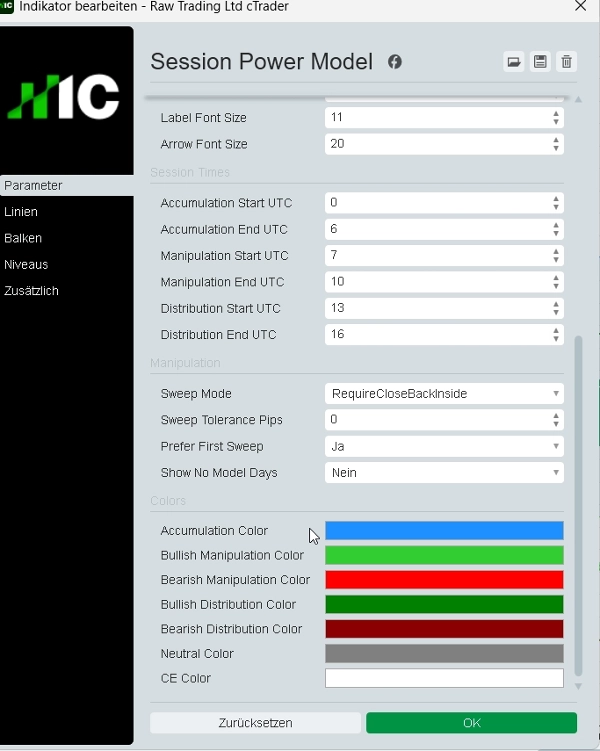
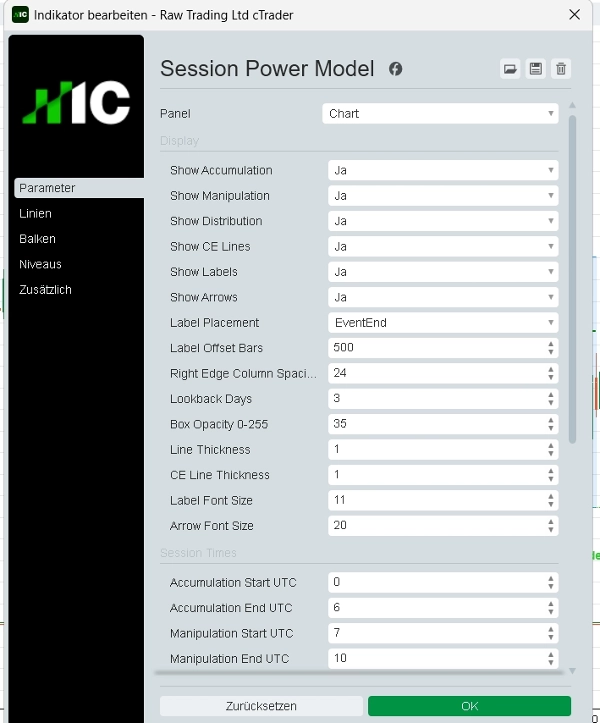
- Configurable session times

- Adjustable lookback days

- Right-edge label placement

- Clean chart overlay

- Custom colors, opacity and label settings

- Store-safe indicator with restricted access rights


Session Power Model is designed for discretionary price action analysis, liquidity-based chart review, session research and backtesting preparation.


This indicator is not a trading robot. It does not execute trades, modify orders or provide guaranteed buy/sell signals. It is a chart visualization and market context tool only.


Trading involves risk. This indicator does not provide financial advice, investment recommendations, statistical probabilities or guaranteed trading results.


Summary

AI summary
Session Power Model is a cTrader indicator that visually segments the trading day into three phases: accumulation, manipulation, and distribution. It highlights the accumulation range, detects liquidity sweeps during the manipulation phase, and displays bullish or bearish distribution phases on the chart. The indicator identifies sell-side sweeps leading to bullish distributions, buy-side sweeps leading to bearish distributions, and mixed scenarios involving both sides. Key features include configurable session times, adjustable lookback periods, session CE lines, sweep arrows, customizable colors and labels, and a clean chart overlay. Designed for discretionary price action analysis, liquidity-based chart review, session research, and backtesting preparation, this tool provides market context visualization without executing trades or offering trading signals. It supports analysis focused on market structure, liquidity sweeps, and support/resistance levels.
Indicator profile
Indicator category
Market structure (SMC)
Output type
Visualisation
Data requirements
Bars only
Supported signals
Divergence
Breakout
Reversal

Customer reviews

0.0
Reviews: 0
Customer reviews
No reviews for this product yet. Already tried it? Be the first to tell others!

Discussion

FAQ

Liquidity Sweep
Market Structure
Liquidity Grab
Support & Resistance
Products available through cTrader Store, including trading bots, indicators and plugins, are provided by third-party developers and made available for informational and technical access purposes only. cTrader Store is not a broker and does not provide investment advice, personal recommendations or any guarantee of future performance.

More from this author

Indicator
SMC
Prop
+6
Automatically draws the Opening Range (High & Low) for Tokyo, London, and New York sessions. Configurable start times,
Indicator
SMC
Prop
+12
Killzone, ICT, SMC, Session, Asia, London, New York, NY PM, Session High, Session Low, Smart Money, Order Flow, Trading
Indicator
SMC
Prop
+12
Shows bullish/bearish bias for 5 timeframes in one panel. Three bias methods, alignment summary, fully configurable.
Indicator
MSS
Key Levels
+4
Maps session ranges, previous highs/lows, equilibrium and premium/discount zones on your cTrader chart.
Indicator
Key Levels
Liquidity Grab
+3
Visual market context dashboard showing bias states, CE positioning, session status and sweep context.
Indicator
MSS
Key Levels
+2
Maps equal highs, equal lows and active liquidity pools directly on your cTrader chart.
Indicator
BOS
Key Levels
+2
Maps bullish and bearish order block zones, CE levels and structure-based price action context.
Indicator
BOS
MSS
+3
Maps BOS, CHoCH, swing breaks and market structure shifts directly on your cTrader chart.

You may also like

Indicator
EMA
AI-assisted
+1
Multi EMA Timeframes lets you stay on your chart and see the exact EMA from any timeframe you choose — up to 5 at once.
Indicator
AI
ATR
+27
Nadaraya-Watson Envelope Indicator
Indicator
VWAP
Forex
+2
Custom VWAP Indicator for cTrader
Indicator
Forex
EURUSD
+3
Forex Strength Meter for cTrader: 4 custom currencies, cross alerts, visual arrows. Trade smarter!
Indicator
MACD
Signal
Enhance your trading strategy with our customizable TradingViewMACD indicator. Optimize and elevate your market analysis
Indicator
Prop
Forex
+4
Automatic Support/Resistance zones from swing points.
Indicator
Volume
Order Block
+1
Elevate your market analysis with the Aggression Delta Volume Profile, a premium, institutional-grade order flow utility
Indicator
AI
ATR
+26
MacD Custom Indicator-Multiple Time Frame
Indicator
BOS
Imbalance
+4
Automatically detects and highlights both Bullish and Bearish Fair Value Gaps (FVGs).
Indicator
ATR
RSI
+1
AI Supertrend MTF uses K-NN Machine Learning to eliminate lag. Features multi-timeframe projection & dynamic glowing clo
Indicator
Forex
Crypto
+3
MARainbow gives you the edge with four customizable moving averages—each color-coded for instant recognition.
Indicator
SMC
Forex
+5
Detect institutional breakout zones with smart volume & channel analysis — by PrimeQuant.
Indicator
MSS
Key Levels
+4
Maps session ranges, previous highs/lows, equilibrium and premium/discount zones on your cTrader chart.
Indicator
ATR
RSI
+3
🚀 Specialized algorithm is designed to confirm entry and exit points with precision 🎯
Indicator
Shows BUY & SELL signals for 3 & 4 BAR PATTERN (Morning star/ Evening star). It is adjustable and it will SHOW ARROWS.
Indicator
RSI
SMC
+17
RSI, MACD, Stochastic, CCI & Momentum divergence scanner with confluence scoring. Never miss a signal again!
Indicator
Order Block
Fair Value Gap
+3
This indicator scans multi-timeframe trend confluence and price action triggers within key supply/demand zones
Indicator
Indices
Commodities
The Advanced CCI & EMA Indicator combines the CCI with 40 & 80 EMA logic to generate precise arrows signaling direction

Price

Since 07/10/2025
2
Sales