Indicator
XAUUSD
Forex
Signal
EURUSD
Scalping
ALMA Smoothed Gaussian Moving Average
"ALMA Smoothed Gaussian Moving Average" logo
03/09/2025
Desktop
Sinceย 16/03/2025
Traded volume
17.81M
Pips won
59.92K
Sales
23
Free installs
432
"ALMA Smoothed Gaussian Moving Average" uploaded image"ALMA Smoothed Gaussian Moving Average" uploaded image"ALMA Smoothed Gaussian Moving Average" uploaded image"ALMA Smoothed Gaussian Moving Average" uploaded image

ALMA Smoothed Gaussian Moving Average (ASGMA) โ€“ by LudwigICT

A precision trend-following indicator that fuses ALMA smoothing with an adaptive Gaussian Moving Average to cut through noise and reveal the true market bias.

๐Ÿ”น How it works:

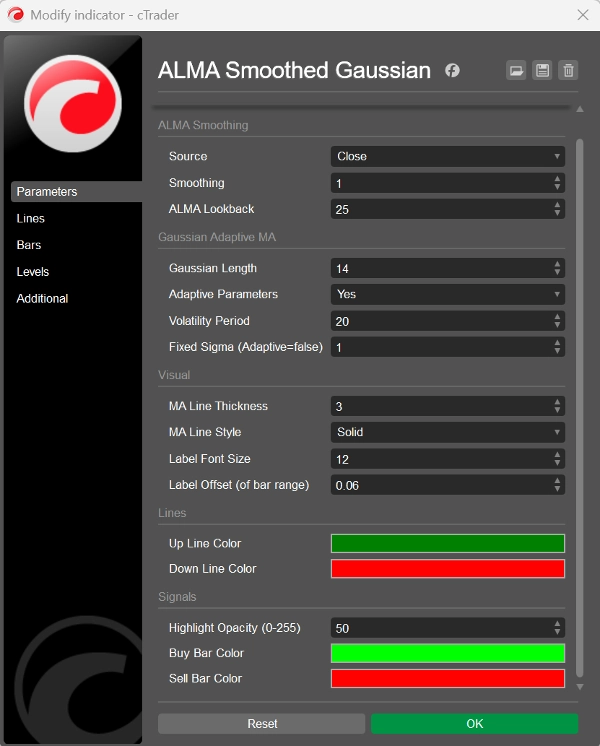
  • Takes your chosen price source (Close, Open, High, Low, HL2, HLC3, OHLC4).
  • Measures percentage change and smooths it with ALMA (Arnaud Legoux MA).
  • Applies a Gaussian filter (adaptive to volatility, or fixed) for a refined trend line.
  • Confirms direction with an EMA of close (7) for responsive alignment.

๐Ÿ”น What you see on the chart:

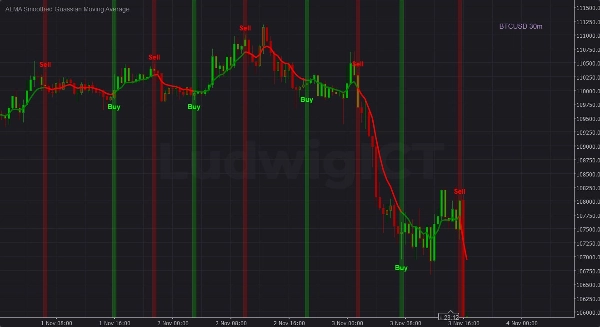
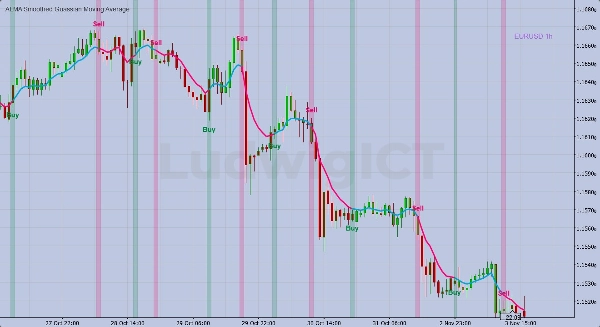
  • Trend line: Green = uptrend, Red = downtrend.
  • Candles recolored: Trend-aligned body & wick colors for instant bias recognition.
  • Buy/Sell signals: Highlighted bars + bold labels when ALMA crosses above/below Gaussian MA.
  • Full-height highlights: Stay visible on pan/zoom (no missed signals).

๐Ÿ”น What it gives traders:
โœ… A clean, non-laggy trend map
โœ… Fast Buy/Sell signals at momentum shifts
โœ… Less chart clutter, more confidence in execution

๐Ÿ‘‰ In short: Itโ€™s a precision trend indicator that filters out noise, adapts to volatility, and gives clear visual Buy/Sell signals.


If you have any questions or run into any issues, feel free to contact me. I'm happy to help You!

Disclaimer:

By using my algorithms, you acknowledge that trading involves inherent risks and that past performance does not guarantee future results. It is essential that you have a solid risk management strategy in place and, above all, that you remain disciplined in adhering to stop-loss levels. Failure to manage risk properly can lead to significant losses. I am not responsible for any financial outcomes resulting from the use of these algorithms. Trade responsibly and always follow proper risk management practices.

Bless up! ๐Ÿ™Œ

More from this author
VALID Hi and Lo
ICT Valid High & Low Detector โ€“ Multi-Pair, Multi-Timeframe
Order Block detector PRO
Order Block PRO โ€” Smart Institutional Zone Detector
AlphaTrend Pro by LudwigICT
Indicator
XAUUSD
Commodities
Forex
+3
Silver Bullet by LudwigICT
Indicator
Indices
XAUUSD
Prop
+8
FREE Squeeze Momentum from TradingView
Squeeze Momentum - Anticipate explosive market moves before they happen
Indicator
Indices
Commodities
Forex
+2
Advanced Swings
ICT Advanced Swings Indicator โ€“ Multi-Timeframe Precision
cBot
XAUUSD
Commodities
Forex
+3
Volatility Sniper Breakout BETA
Volatility Sniper Breakout Bot (Beta) โ€“ Intelligent Breakout Trading for Volatile Markets
Indicator
Grid
RSI
Breakout
+18
Logarithmic Framework by LudwigICT
Indicator
Grid
NAS100
RSI
+16
Smart Money Breakout Channels
Smart Money Breakout Channels by LudwigICT โ€” cTrader/cAlgo Indicator
cBot
Scalping
FRAMEWORK
ICT Framework cBot โ€“ Advanced Trading Automation for Any Pair & Timeframe
MMXM Structure by Ludwig
MMXM Structure by LudwigICT โ€“ Professional Market Structure Mapping Tool
Indicator
VWAP
RSI
XAUUSD
+9
Turtle Soup ICT Strategy
Turtle Soup ICT Strategy โ€“ Smart Liquidity Trap Detection for cTrader
ADVANCED ICT + ADR + AWR SUITE PRO
ADVANCED ICT + ADR + AWR SUITE PRO (The Ultimate All-in-One Toolkit for Price Action Traders)
Indicator
NAS100
NZDUSD
XAUUSD
+14
Volume Profile Pivot Anchored
Anchor volume profiles to pivots with POC, VAH, VAL and real-time insights for clearer trade decisions.
DIGITAL IMPLEMENTATION SYSTEM
LudwigICT โ€“ Digital Root & IDR (cTrader Automate)
Indicator
NAS100
NZDUSD
XAUUSD
+14
Elliott Wave Fib Auto
๐Ÿš€ Automated Elliott Wave & Fibonacci tool for cTrader. Spot trends, corrections & retracements fast.
Indicator
VWAP
RSI
Breakout
+7
Anchored VWAP by LudwigICT
Anchored VWAP (Auto hi-lo) by LudwigICT
OHLC PRO by LudwigICT
OHLC PRO โ€“ Advanced Session & Market Structure Tool
You may also like
Indicator
RSI
Signal
MA-RSI HTF Confirmation
MA-RSI HTF Confirmation: Eliminate false signals and trade with confidence!
Binary Options Signals Pro
Binary Options Signals Pro โ€“ Precision Trading at Your Fingertips
Indicator
Breakout
AI
Scalping
KaufmanEfficiencyRatio
A precision tool for measuring how efficiently price moves from point A to B.
VWAP Tabajara
VWAP Tabajara
Indicator
RSI
XAUUSD
Breakout
+6
Market Imbalance
Identifies market imbalances and visually marks key areas based on price patterns and volatility (ATR).
Scalper Signal MTF
This code is a custom scalping indicator for the cTrader platform.
Indicator
Grid
RSI
Breakout
+18
Logarithmic Framework by LudwigICT
Simple MACD Histogram
Simple MACD Histogram with color-coded rising (green) and falling (red) momentum bars.
Parabolic RSI Alertย  V1
Master RSI reversals with Parabolic SAR precision! Get real-time alerts for high-probability trend changes.
KANDIKA HEAT MAP
Color-Based Market Pressure & Volatility Visualizer The Kandika Heatmap Indicator
FAIR VALUE GAP INDICATOR
Pinpoint FVGs, track fills and see mitigation stats โ€” trade imbalances with clarity and confidence.
Indicator
Grid
XAUUSD
ATR
+5
Trend Scope pro
Trend Scope Pro โ€“ Smarter Trend Analysis with Linear Regression Channels
Indicator
Indices
E7 BlackScholes Model
Option pricing using the BlackScholes model and the Math.Numerics packages
MA Sabres
Conquer the markets with MA Sabres! This indicator spots trend flips with MAs and cool Sabre shapes & alerts.
Top-rated
Free
EKVWAP
This is an advanced VWAP indicator (Anchored or non-Anchored) that allows you to customize all the aspects of it.
Indicator
Indices
Breakout
Supertrend
[CB] Pivot Points Pro
You can use the cTrader Pivot Points Pro indicator to find a good pullback entry in a trend
Indicator
Indices
Stocks
Commodities
+2
SymbolTFOverlay
The SymbolTFOverlay display the current symbol and timeframe as a semi-transparent text overlay on the chart.
MultiTF-Pivot_SR
MultiTF Pivot and SR Indicator