
Description
⚠️ We moved to 👉 PrimeQuant
🚫🚫🚫 Don't buy this indicator!
⚡ NEXT-GENERATION VERSION AVAILABLE: This classic LudwigICT tool has been redesigned, restructured, and re-released under our new developer brand, PrimeQuant. The new version features a streamlined UI and updated properties for current market conditions. Get the upgraded version at a discounted price here:
👉 Complete ICT SMC Suite - ADR AWR AMR OHLC Fibs EIS SR Alert
👉 Complete ICT SMC Suite - ADR AWR AMR OHLC Fibs EIS SR Alert
👉 Complete ICT SMC Suite - ADR AWR AMR OHLC Fibs EIS SR Alert
(Please note: The LudwigICT listing remains active for legacy users but will no longer receive updates or active price discounts.)
🔥 ADVANCED ICT + ADR + AWR SUITE PRO
Stop guessing and start seeing the market with institutional clarity. The ADVANCED ICT SUITE PRO by LudwigICT is a professional-grade, all-in-one charting toolkit designed for the discerning price action trader. Meticulously engineered to be a stable and visually perfect replication of the legendary Pine Script indicator, this suite automates the complex task of charting critical market structures, freeing you to focus on what truly matters: your strategy and execution.
This is not just another indicator; it is a complete framework for viewing the market. By seamlessly integrating the core ICT concepts of Price, Time, Volatility, and Momentum, this suite provides an unparalleled, institutional-grade view of the financial markets, directly on your cTrader chart.
Why Choose the LudwigICT Suite?
- All-in-One Powerhouse: This single indicator replaces dozens of separate tools. You get Fibonacci analysis, range projections, multi-tiered market structure, higher timeframe context, and momentum coloring in one lightweight and efficient package.
- Unshakeable Stability is King: Have you ever used an indicator where the levels jump and repaint as you scroll? We have solved that. Our proprietary Smart Anchoring logic ensures your Fibonacci levels are locked to significant historical pivots, providing a consistent and reliable framework that only adapts when the market truly changes structure.
- Visual Perfection & Clarity: We believe a trader's most valuable asset is their focus. This suite is designed to enhance clarity, not create clutter. The elements are clean, non-intrusive, and fully customizable. The default settings are ready for professional use right out of the box.
- Precision Engineered for Serious Traders: Every calculation, from the Elder Impulse System to the Average Daily Range, has been rigorously tested to be a 1:1 match with the original, trusted Pine Script logic. No shortcuts, no approximations.
Key Features Explained
The suite is composed of several powerful, independent modules that you can toggle and customize to fit your exact trading style.
✔️ Stable & Anchored Fibonacci Retracement (The Heart of the Suite)
The most stable and intelligent Fibonacci tool available on cTrader.
- Smart Anchoring Logic: Automatically identifies and locks onto the last major, significant swing high and low, providing a stable and reliable price range for your analysis.
- Intelligent Breakout Reset: The Fibonacci levels remain anchored until the price makes a decisive close beyond the established range (breakout distance is fully customizable). This prevents the drawing from jumping on minor pullbacks and ensures it only adapts when the market structure has truly shifted.
- The Signature Dashed Trend Line: The iconic dashed diagonal line connects the anchor points of your Fibonacci range, providing a clear visual representation of the trend you are analyzing.
- Optional ZigZag Overlay: For additional confirmation, you can enable a classic ZigZag overlay to see the path of all historical pivots. This is disabled by default to maintain a clean chart.
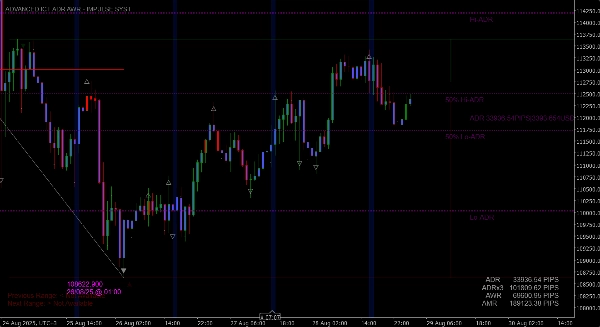
✔️ Elder Impulse System (Momentum Bar Coloring)
Instantly gauge the market's triple-consensus: trend, momentum, and force.
- Green Bars: Indicate bullish consensus (13 EMA rising & MACD Histogram rising). The market is in a strong uptrend.
- Red Bars: Indicate bearish consensus (13 EMA falling & MACD Histogram falling). The market is in a strong downtrend.
- Blue Bars: Indicate a neutral state or disagreement between trend and momentum. A time for caution.
- Bar Borders: A subtle but critical feature. A colored border is drawn around each bar to show its true direction (bullish or bearish close), which is essential for accurate candlestick analysis when the main color is overridden.
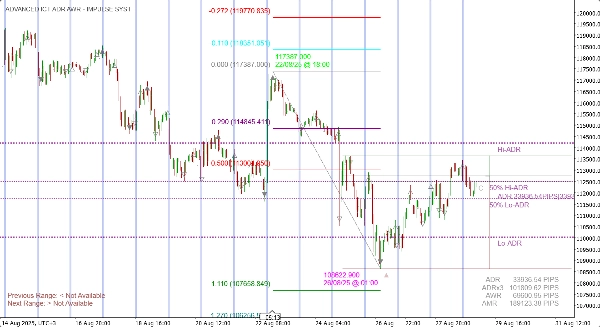
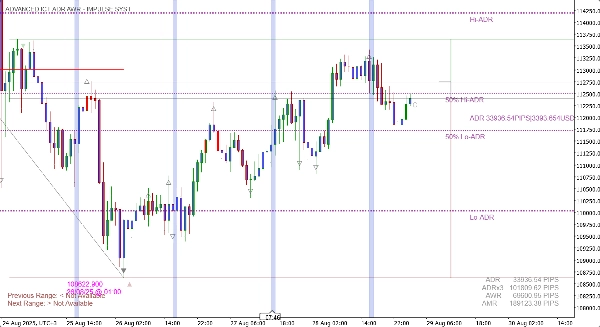
✔️ Advanced Range Projections (ADR, AWR, AMR)
Know your instrument's boundaries and set realistic daily, weekly, and monthly targets.
- Dynamic Projections: Automatically calculates and plots the Average Daily Range, Average Weekly Range, and Average Monthly Range.
- Projected Highs & Lows: See projected support and resistance levels based on the calculated ranges.
- 50% Midpoints: Crucial for identifying equilibrium and potential reversal points within the projected range.
- On-Screen Data Table: A clean, customizable table displays all key range values in Pips and/or currency for quick, at-a-glance reference.
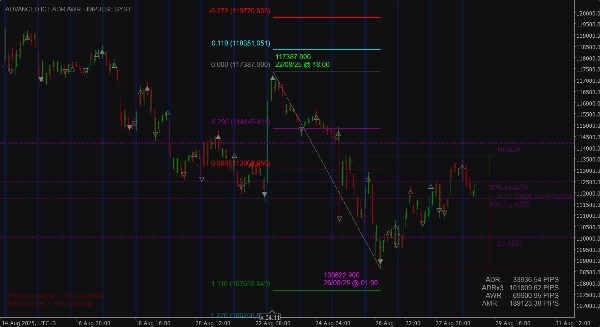
✔️ Multi-Tiered Market Structure (ST, IT, LT Swings)
Stop drawing swing points manually. The indicator does it for you.
- Automatic Identification: Plots Short-Term (ST), Intermediate-Term (IT), and Long-Term (LT) swing highs and lows directly on your chart.
- Clear Symbols: Uses a simple and intuitive system of dots and triangles to represent the hierarchy of market structure.
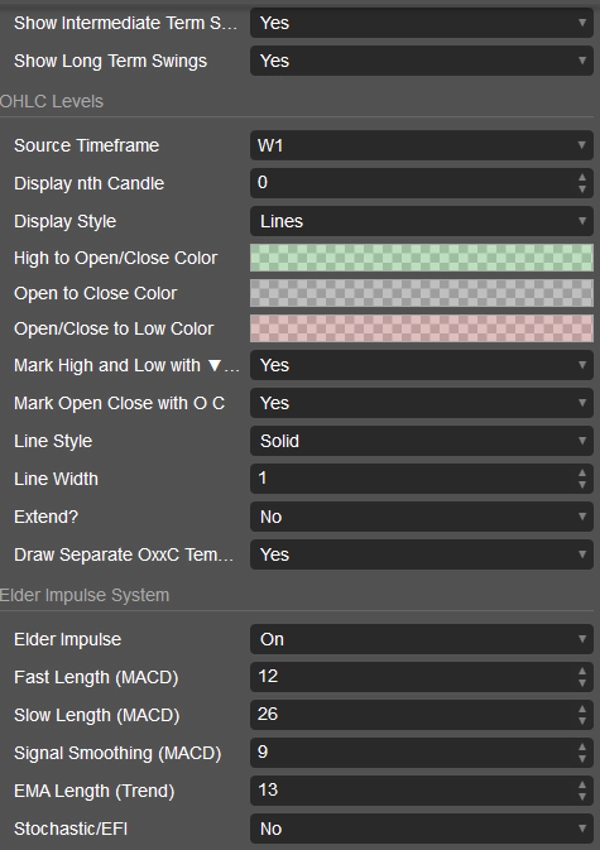
✔️ Higher Timeframe OHLC Levels
Trade with multi-timeframe context without ever leaving your chart.
- Key Price Levels: Overlay the Open, High, Low, and Close from any higher timeframe (e.g., Weekly, Daily) as clean lines or shaded boxes.
- Session Analysis: Instantly see where the current price is in relation to the previous day's or week's key levels.
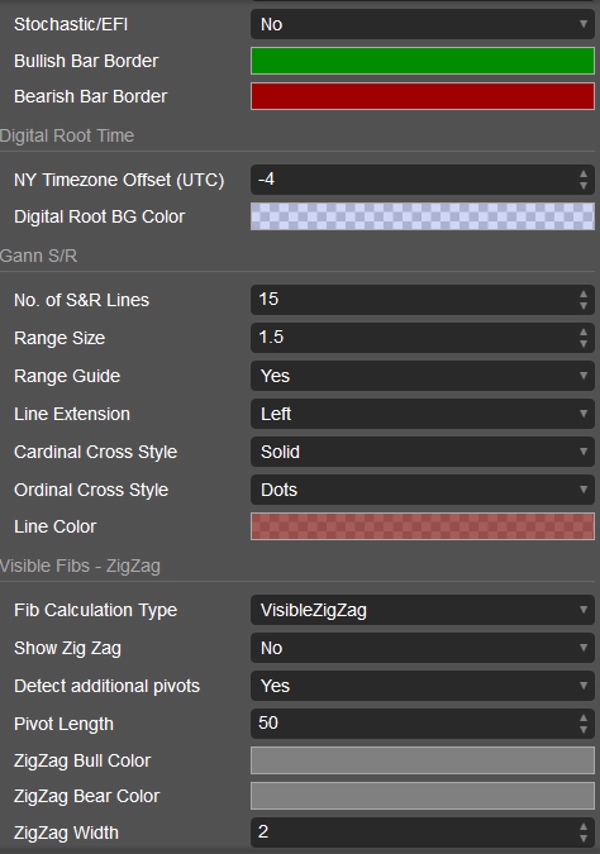
✔️ Dynamic Support & Resistance Tools
- Gann S/R Levels: A powerful, mathematically-derived set of support and resistance lines that adapt to the instrument's volatility.
- Digital Root Time: Highlights specific, pre-defined time windows with full-height vertical bars that dynamically resize as you pan and zoom, ensuring they are always visible.
How to Use the ADVANCED ICT SUITE PRO
This suite is a versatile toolkit, not a simple "buy/sell" signal indicator. Here are a few ways to integrate it into your trading:
- High-Probability Confluence Trading:
- Wait for the price to pull back into a key Fibonacci Level (e.g., the 0.618 or 0.786 level) within a stable, anchored trend.
- Look for confluence: Does this Fib level align with a Higher Timeframe OHLC Level or a Gann S/R Line?
- Use the Elder Impulse System for your entry trigger. Wait for the bar coloring to shift in your favor (e.g., from blue/red to green for a long entry) before executing the trade.
- Set your profit targets at the next Fib extension level or the projected ADR/AWR High/Low.
- Trend Confirmation and Momentum Entries:
- Identify the overall trend using the Market Structure swing points (e.g., a series of higher highs and higher lows).
- During a pullback, wait for the Elder Impulse color to turn blue (neutral).
- Enter the trade as soon as the color flips back to your trend's direction (green for an uptrend, red for a downtrend)
- Range and Session Reversal Trading:
- Observe price approaching a key boundary, such as the projected ADR High or the Previous Day's High.
- Look for signs of exhaustion, such as price failing to close above the level and the Elder Impulse color turning blue or flipping to the opposite color.
- Enter a reversal trade, targeting the 50% ADR level or the other side of the range.
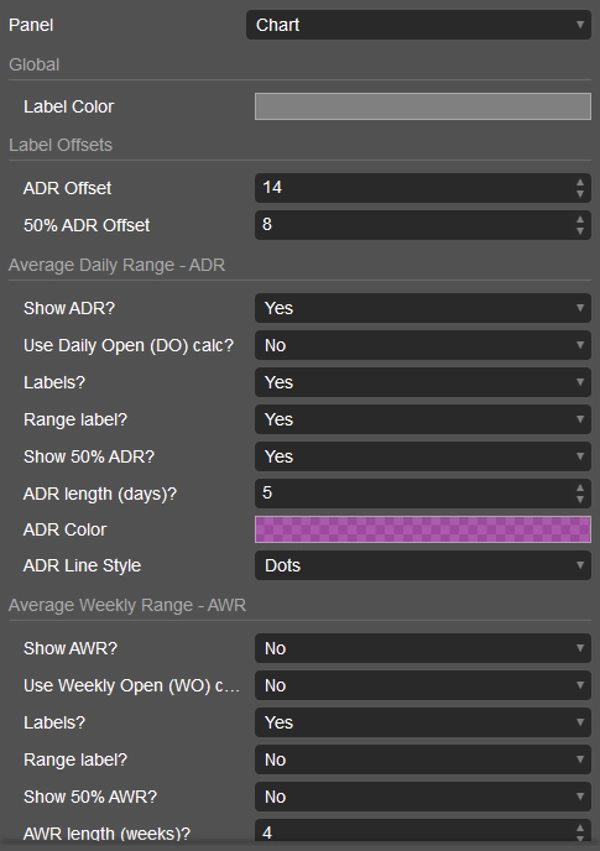
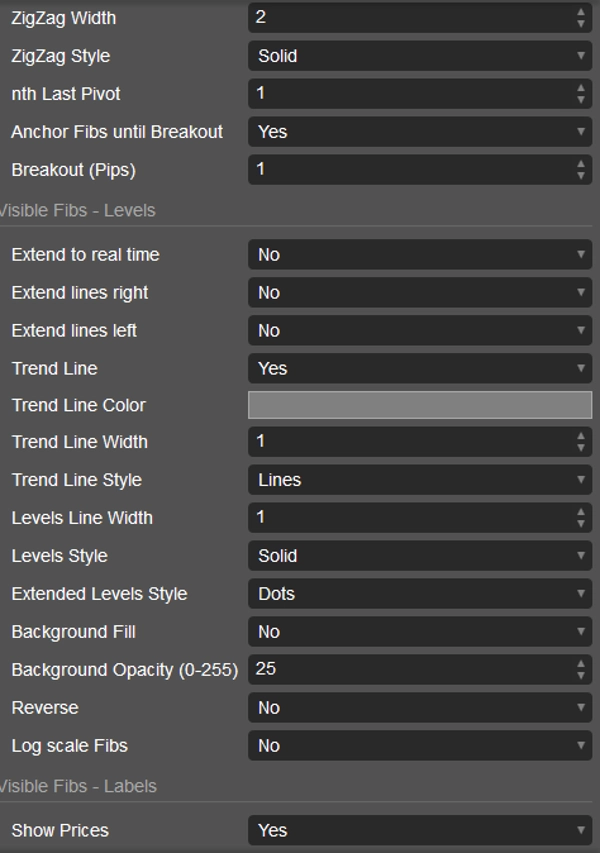
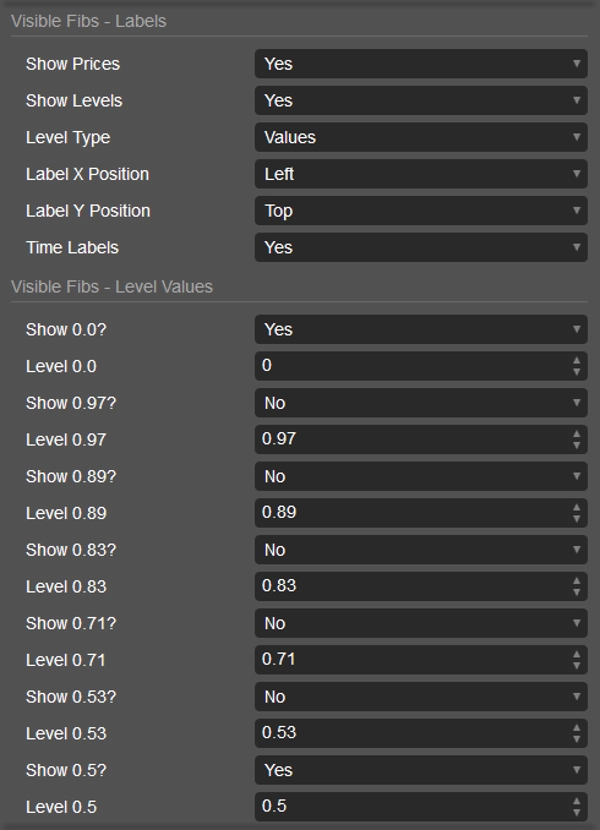
Full List of Customizable Parameters
(This section gives customers confidence in the product's flexibility)
- Global Settings: Label Colors, Offsets.
- Average Daily Range (ADR): Toggle On/Off, Use Daily Open, Show Labels, Show Range, Show 50% Level, Lookback Period, Color, Line Style.
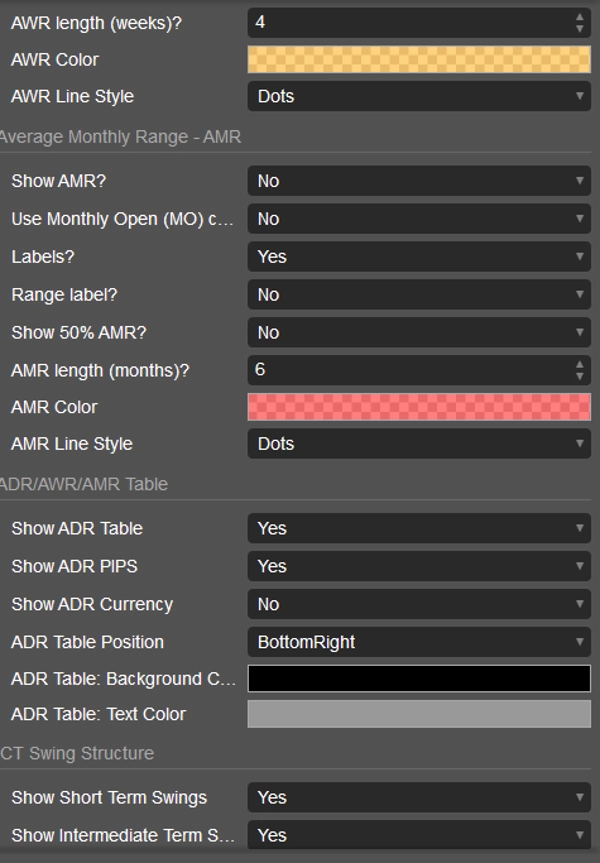
- Average Weekly Range (AWR): Fully customizable settings, same as ADR.
- Average Monthly Range (AMR): Fully customizable settings, same as ADR.
- Data Table: Toggle On/Off, Show Pips, Show Currency, On-Screen Position, Colors.
- ICT Market Structure: Toggle ST, IT, and LT swings independently.
- OHLC Levels: Source Timeframe, Candle Lookback, Display Style (Lines/Boxes), All Colors, Mark Highs/Lows, Mark Open/Close, Extend Lines, Show Template.
- Elder Impulse System: Toggle On/Off, All MACD and EMA Parameters, Stochastic/EFI Mode, Bullish/Bearish Bar Border Colors.
- Digital Root Time: NY Timezone Offset, Background Color.
- Gann S/R: Number of Lines, Range Size, Line Extension, Line Styles, Color.
- Visible Fibs: Calculation Type (ZigZag/Chart Range), Show ZigZag (default off), All ZigZag Parameters, Stable Anchoring & Breakout Reset, All Level and Line Parameters, Background Fill, Reverse, Log Scale, Label Controls, and over 25 individual Fibonacci levels that can be toggled, customized, and recolored.
Elevate your trading with the ultimate price action toolkit. Stop drawing lines and start seeing the setups. Get the ADVANCED ICT SUITE PRO by LudwigICT today! 🚀🚀🚀
If you have any questions or run into any issues, feel free to contact me. I'm happy to help You!
Disclaimer:
By using my algorithms, you acknowledge that trading involves inherent risks and that past performance does not guarantee future results. It is essential that you have a solid risk management strategy in place and, above all, that you remain disciplined in adhering to stop-loss levels. Failure to manage risk properly can lead to significant losses. I am not responsible for any financial outcomes resulting from the use of these algorithms. Trade responsibly and always follow proper risk management practices.
Bless up! 🙌
Summary
Customer reviews
5 | 50 % | |
4 | 50 % | |
3 | 0 % | |
2 | 0 % | |
1 | 0 % |


