
Description
⚠️ We moved to 👉 PrimeQuant
🚫🚫🚫 Don't buy this indicator!
⚡ NEXT-GENERATION VERSION AVAILABLE: This classic LudwigICT tool has been redesigned, restructured, and re-released under our new developer brand, PrimeQuant. The new version features a streamlined UI and updated properties for current market conditions. Get the upgraded version at a legacy-discounted price here:
👉 Elliott Waves Auto Detection + Fibonacci
👉 Elliott Waves Auto Detection + Fibonacci
👉 Elliott Waves Auto Detection + Fibonacci
(Please note: The LudwigICT listing remains active for legacy users but will no longer receive updates or active price discounts.)
📈 Elliott Wave – Fibonacci Levels [LudwigICT]
🔥 Unlock the full power of Elliott Wave Theory combined with dynamic Fibonacci retracements – all automated for you inside cTrader!
This indicator brings professional-grade wave counting and precise Fibonacci zones directly to your charts, making trend forecasting and trade execution easier than ever.
✨ Key Features
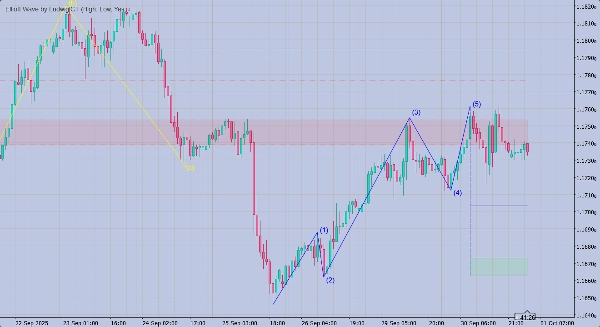
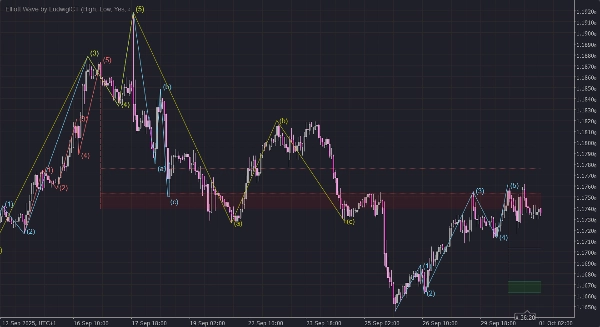
🔹 Automatic Wave Detection
- Identifies 5-wave motive structures (1–5).
- Detects 3-wave corrective patterns (A–B–C) immediately after motive completion.
🔹 Dynamic Fibonacci Retracements
- Auto-plots key retracement zones: 0.500 • 0.618 • 0.764 • 0.854.
- Updates in real time with wave development.
- Highlights invalidations with dotted lines.
🔹 Multi-ZigZag Framework
- Runs three independent ZigZag calculations with customizable length & colors.
- Ensures flexible sensitivity for different market conditions.
🔹 Professional Visuals
- Clean wave labels
(1)…(5)and(a)(b)(c)placed with ATR-based smart offsets. - Breakout boxes with bold X markers when levels are breached.
- Gradient-like Fibonacci fill areas for easy spotting.
🔹 Trade Assistance
- Automatic identification of a possible new Wave (1) after A–B–C correction.
- Audio alerts for new waves, invalidations, and breakout signals.
🛠 How to Use
- Apply to Chart
- Simply drag & drop Elliott Wave – Fibonacci Levels [LudwigICT] onto your cTrader chart.
- Works on all timeframes (scalp, swing, long-term).
- Customize Parameters
- Read the Waves
- ✅ Waves
(1–5)= Motive wave (trend direction). - 🔄 Waves
(a–b–c)= Corrective wave (countertrend). - 📊 Fibonacci levels show likely retracement zones for entries/exits.
- ✅ Waves
- Trade with Confidence
- Enter trades around Fibonacci retracements after a completed motive wave.
- Manage risk when levels are broken (indicator alerts you automatically).
- Look for the Next Wave (1) icon to anticipate new trend cycles.
🎯 Why Choose This Indicator?
✅ Saves hours of manual wave counting.
✅ Avoids subjective mistakes in Elliott Wave analysis.
✅ Clean, precise, professional visuals directly on your chart.
✅ Created & optimized by LudwigICT, trusted in trading automation.
🖥 Compatibility
- Platform: cTrader Desktop v5+
- Instruments: Works on Forex, Stocks, Indices, Commodities, Crypto.
- Timeframes: From 1m scalping to weekly swing analysis.
⚡️ Get Started Now
🚀 Add Elliott Wave – Fibonacci Levels [LudwigICT] to your trading arsenal today and take your chart analysis to the next level!
👉 Perfect for traders who rely on price action, structure, and Fibonacci retracements to time their entries and exits with precision.
If you have any questions or run into any issues, feel free to contact me. I'm happy to help You!
Disclaimer:
By using my algorithms, you acknowledge that trading involves inherent risks and that past performance does not guarantee future results. It is essential that you have a solid risk management strategy in place and, above all, that you remain disciplined in adhering to stop-loss levels. Failure to manage risk properly can lead to significant losses. I am not responsible for any financial outcomes resulting from the use of these algorithms. Trade responsibly and always follow proper risk management practices.
Bless up! 🙌
Summary
Customer reviews
5 | 100 % | |
4 | 0 % | |
3 | 0 % | |
2 | 0 % | |
1 | 0 % |


