
Description
═══════════════════════════════════════════════════════════════
EMA MTF TREND PRO — Multi-Timeframe Trend Analysis Indicator
cTrader Overlay Indicator
═══════════════════════════════════════════════════════════════
See the full trend picture across 6 timeframes — in one table,
on one chart, without switching windows.
───────────────────────────────────────────────────────────────
WHAT IT DOES
───────────────────────────────────────────────────────────────
EMA MTF Trend Pro combines EMA trend direction, Wilder channel
structure, Kijun-sen levels, ADX strength, crossover signals,
and momentum exhaustion into a single live dashboard.
Every row in the table is a different timeframe. Every column
answers a different question about that timeframe. One glance
tells you whether timeframes agree — and whether it is safe to
enter.
───────────────────────────────────────────────────────────────
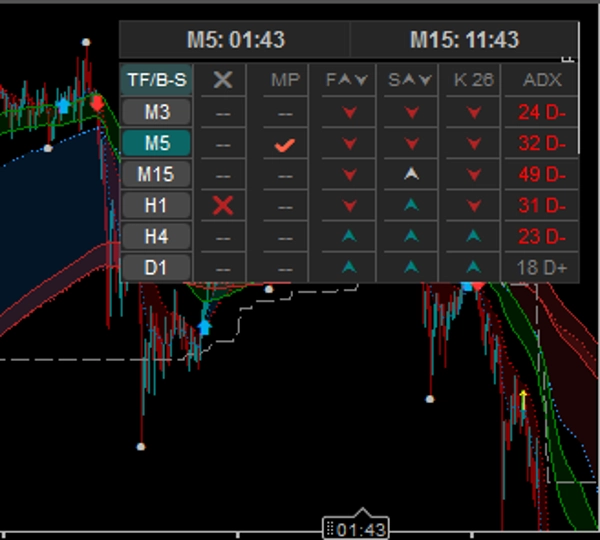
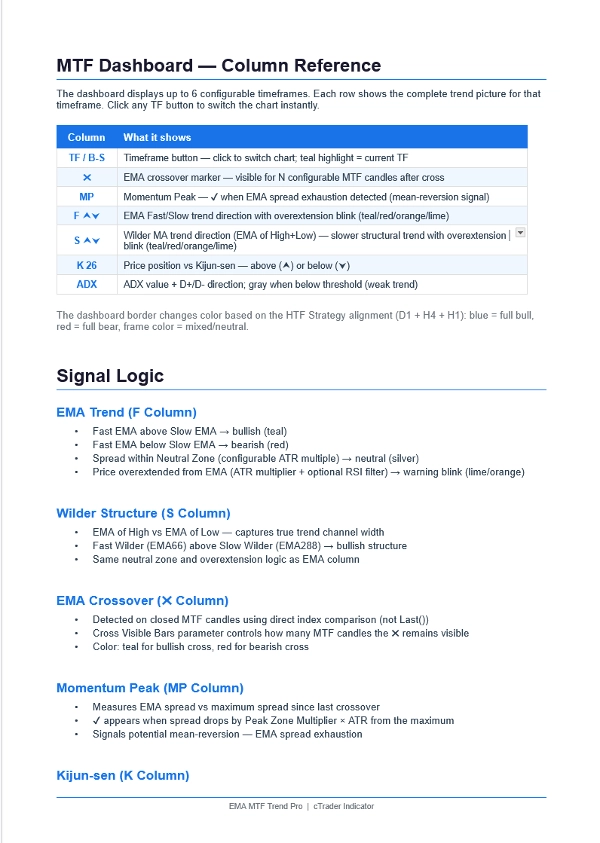
DASHBOARD — 6 TIMEFRAMES × 7 COLUMNS
───────────────────────────────────────────────────────────────
Column What it shows
──────── ──────────────────────────────────────────────────
TF/B-S Timeframe button — click to switch chart instantly
Teal highlight = currently displayed timeframe
✖ EMA crossover — visible for N configurable candles
Teal = bullish cross | Red = bearish cross
MP Momentum Peak — ✔ when EMA spread is exhausted
Mean-reversion warning signal
F ⮝⮟ EMA Fast vs Slow trend direction
Teal = up | Red = down | Silver = neutral
Blinks when price is overextended from EMA
S ⮝⮟ Wilder MA structure (EMA of High/Low)
Slower, more structural trend filter
K 26 Price vs Kijun-sen
⮝ = price above (support) | ⮟ = below (resistance)
ADX Trend strength + D+/D- direction
Gray = weak/ranging market (below threshold)
───────────────────────────────────────────────────────────────
FEATURES
───────────────────────────────────────────────────────────────
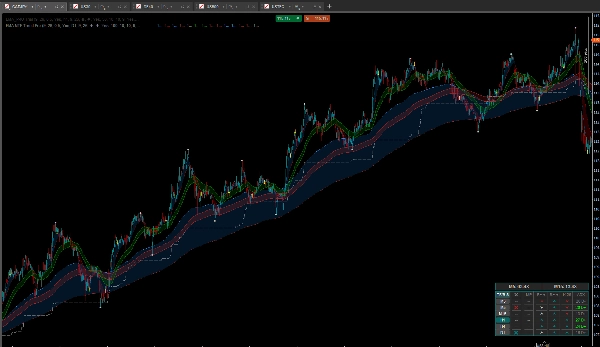
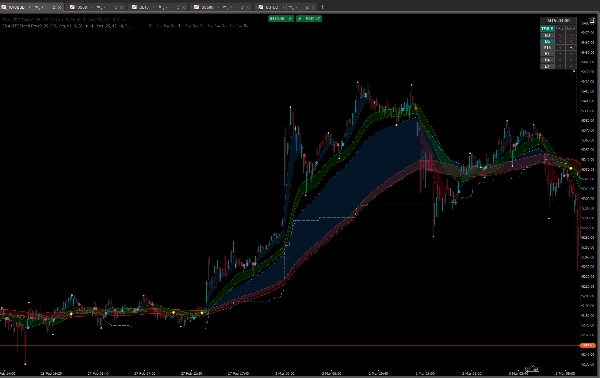
EMA CLOUD SYSTEM
• Fast + Slow EMA with colored cloud fill
• Neutral zone detection (configurable ATR multiplier)
• Overextension alerts with RSI filter
MTF EMA OVERLAY
• Project any higher-TF EMA onto the current chart
• Linear interpolation — smooth lines, no steps
• Crossover arrows with configurable symbols and colors
• Auto-hides overlay arrows when a higher TF is selected
in the dashboard (prevents visual clutter)
SWING HIGHS & LOWS
• Alternating SH / SL dots — no duplicate consecutive highs
• Optional SH / SL text labels with ATR-based positioning
• Configurable dot size, label size, colors
• Single on/off toggle for entire swing display
KIJUN-SEN
• Standard Hosoda definition (matches TradingView / MT4)
• Configurable period
• Also available as MTF overlay line on chart
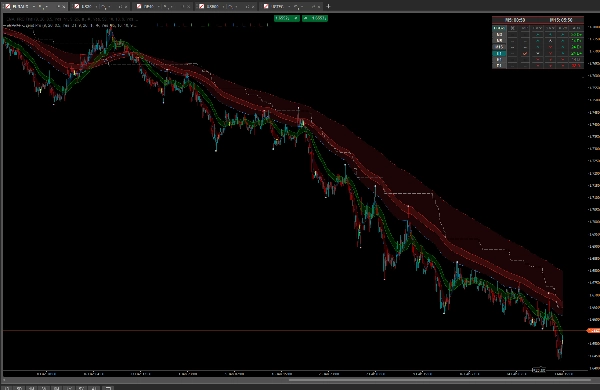
MA-WILDER BANDS
• EMA of High and EMA of Low — creates a trend channel
• Fast band (EMA66) + Slow band (EMA288)
• Available on chart and as MTF overlay
HTF STRATEGY BORDER
• Dashboard border turns teal when D1 + H4 + H1 are
all bullish (EMA + Wilder aligned)
• Turns red when all three are bearish
• Instant visual confirmation of full multi-TF alignment
CANDLE COUNTDOWN TIMER
• Dual timers — any two timeframes
• Second timer can follow the current chart TF
• Compact layout in single-column mode
COMPACT / FULL MODE
• Click the TF/B-S header to toggle
• Full mode: 7 columns (all signals)
• Compact mode: 3 columns (TF, EMA, Wilder) — minimal space
───────────────────────────────────────────────────────────────
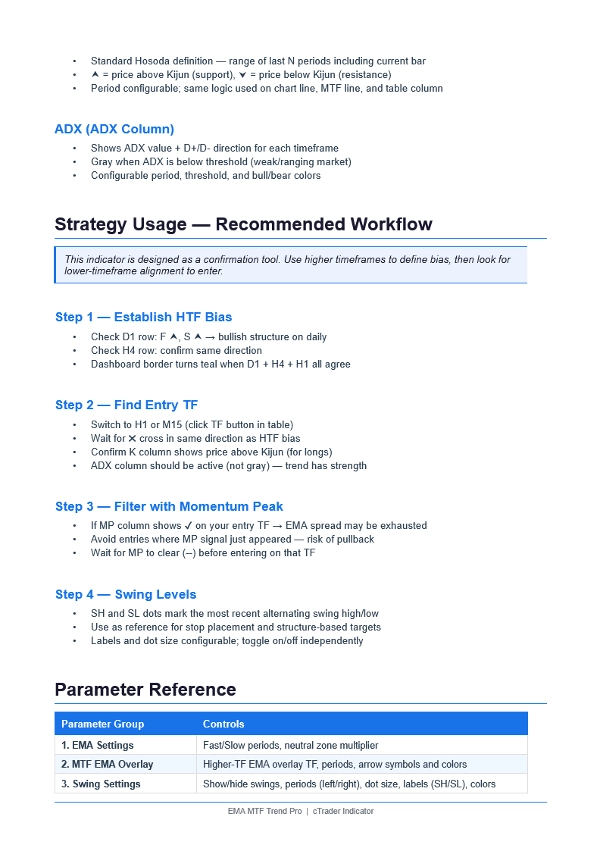
STRATEGY — HOW TO USE
───────────────────────────────────────────────────────────────
STEP 1 — ESTABLISH BIAS (Higher Timeframes)
• D1 row: F ⮝ + S ⮝ = bullish daily structure
• H4 row: same direction = trend confirmed
• Dashboard border turns teal = D1 + H4 + H1 all agree
STEP 2 — FIND ENTRY (Lower Timeframe)
• Click H1 or M15 in the table to switch chart
• Wait for ✖ cross in the same direction as HTF bias
• K column shows ⮝ (price above Kijun) for longs
• ADX column is active, not gray (trend has strength)
STEP 3 — FILTER WITH MOMENTUM PEAK
• MP column shows ✔ → EMA spread exhausted → avoid entry
• Wait for MP to clear (--) before entering
• Use on lower TFs to avoid entering at EMA extremes
STEP 4 — USE SWING LEVELS
• SH dot = most recent swing high (resistance / stop ref)
• SL dot = most recent swing low (support / target ref)
• Dots alternate — always one high, one low at a time
───────────────────────────────────────────────────────────────
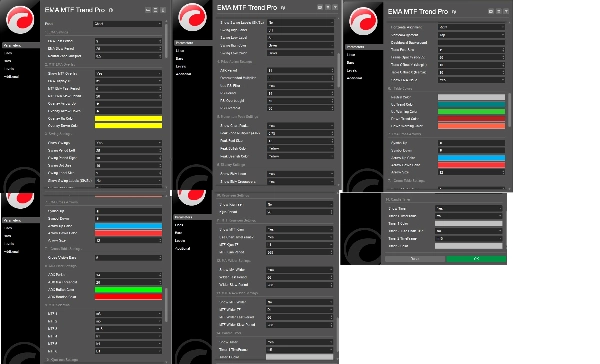
PARAMETER GROUPS
───────────────────────────────────────────────────────────────
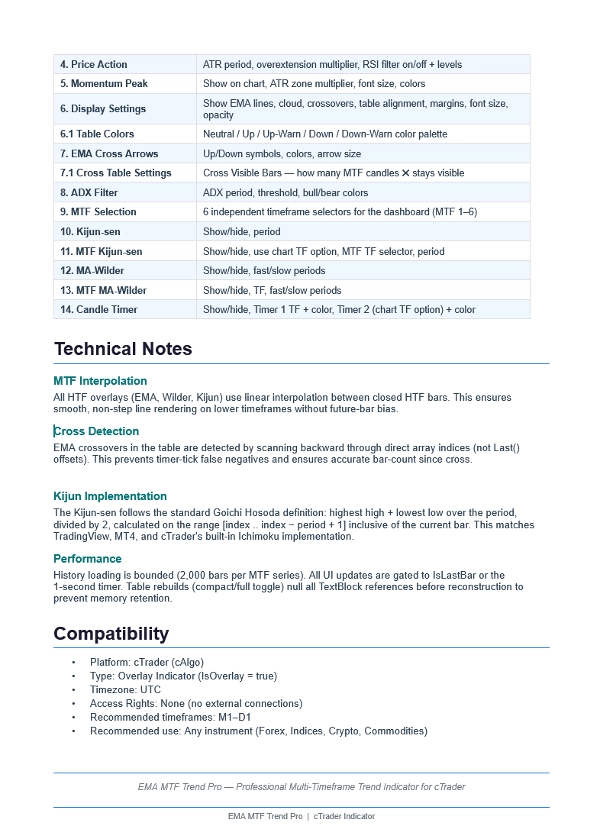
1. EMA Settings — Fast/Slow periods, neutral zone
2. MTF EMA Overlay — TF, periods, arrow style
3. Swing Settings — Show/hide, periods, labels, colors
4. Price Action — ATR, overextension, RSI filter
5. Momentum Peak — Zone multiplier, font, colors
6. Display Settings — Lines, cloud, table layout
6.1 Table Colors — Full color palette control
7. EMA Cross Arrows — Symbols, colors, size
7.1 Cross Table Settings — Cross Visible Bars (N candles)
8. ADX Filter — Period, threshold, colors
9. MTF Selection — 6 × independent TF selectors
10. Kijun-sen — Show/hide, period
11. MTF Kijun-sen — TF, period, chart TF option
12. MA-Wilder — Show/hide, fast/slow periods
13. MTF MA-Wilder — TF, fast/slow periods
14. Candle Timer — TFs, colors, chart TF option
───────────────────────────────────────────────────────────────
Summary
Customer reviews
5 | 0 % | |
4 | 100 % | |
3 | 0 % | |
2 | 0 % | |
1 | 0 % |


