
Fixed Range Volume Profile
Indicator
2 purchases
Version 1.0, Jan 2026
Windows, Mac
4.0
Reviews: 2
Description
How to Use the Fixed Range Volume Profile (FRVP)
- Activate the Indicator: Drag and drop the FRVP Indicator onto your desired chart from the cTrader Automate or Indicators menu.
- Select the Analysis Tool: Locate the standard Rectangle Drawing Tool in the cTrader toolbar (typically on the right or left side of the platform).
- Define Your Range: Click and drag the rectangle over the specific price action and time period you wish to analyze.
- Initialize the Profile: After drawing, click and nudge the rectangle slightly. This "handshake" between the drawing and the indicator triggers the volume calculation, instantly generating the histogram, POC, and Value Area lines.
- Adjust Dynamically: You can drag the edges of the rectangle to expand the time range or move it to a different price leg; the volume profile will automatically recalculate to reflect the new area.
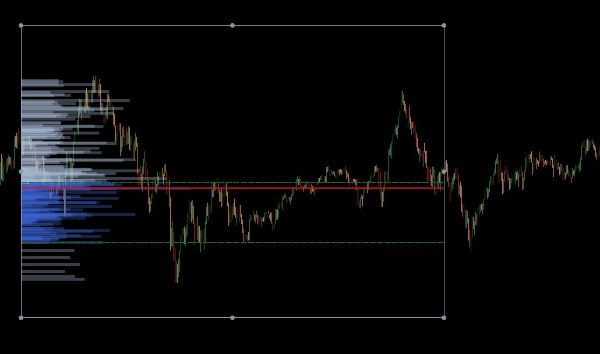
The Fixed Range Volume Profile (FRVP) for cTrader is a sophisticated analysis tool designed to identify significant price levels by calculating volume distribution over a specific time and price range. Unlike standard volume indicators that correspond to time, this indicator focuses on price density to reveal market sentiment.
Core Features
- Dynamic Range Selection: The indicator automatically calculates and updates whenever you draw or move a standard rectangle on your cTrader chart.
- Key Level Identification:
- Point of Control (POC): Highlights the price level with the highest traded volume, acting as a "magnet" for price action.
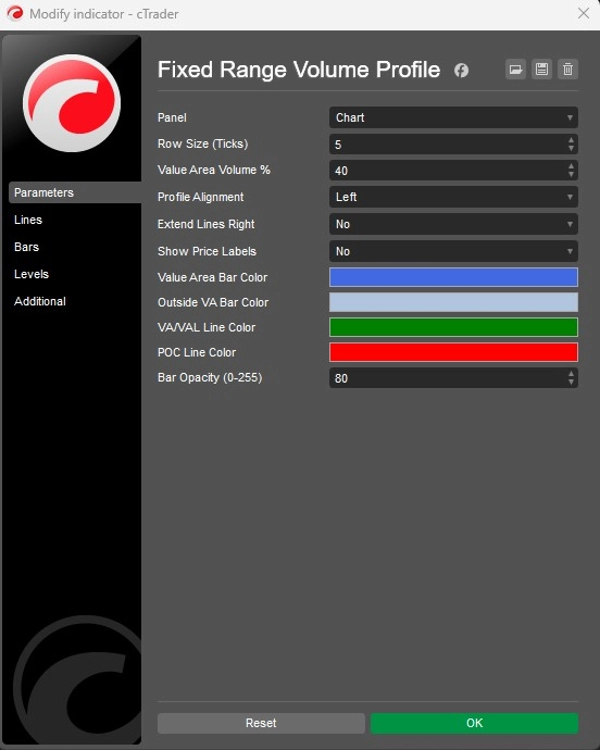
- Value Area High/Low (VAH/VAL): Defines the boundaries where a specific percentage of volume (default 40%) was traded.
- Customizable Layouts:
- Alignment: Choose to display the volume histogram from the Left or Right side of the box.
- Granularity: Adjust the Row Size (default 5 ticks) to control the detail of the volume bars.
- Visuals: Full control over bar colors (Value Area vs. Outside), opacity, and price label visibility.
Strategic Application
- Support & Resistance: High Volume Nodes (HVN) often act as strong support or resistance, while Low Volume Nodes (LVN) represent "thin" areas where price may move quickly.
- Trend Confirmation: Use the Extend Right feature to see how historical volume levels interact with current price action as it develops.
Summary
AI summary
The Fixed Range Volume Profile (FRVP) indicator for cTrader analyzes volume distribution within a user-defined price and time range using a standard rectangle drawing tool. By selecting and adjusting this rectangle on the chart, the indicator dynamically calculates and displays a volume histogram along with key levels: Point of Control (POC), which marks the price with the highest traded volume, and Value Area High/Low (VAH/VAL), defining the volume concentration boundaries. Users can customize the histogram’s alignment, granularity (row size), colors, opacity, and price label visibility. The indicator supports dynamic range adjustments by dragging the rectangle edges, automatically recalculating volume data. Strategically, it helps identify support and resistance zones through high and low volume nodes and offers trend confirmation by extending volume levels into current price action. The FRVP is applicable across various markets including Forex, cryptocurrencies, commodities, indices, and stocks, and supports symbols such as BTCUSD, EURUSD, GBPUSD, XAUUSD, and NAS100. It integrates with cTrader’s drawing tools and provides a detailed volume-based perspective on price action beyond standard time-based volume indicators.
Indicator profile
Customer reviews
4.0
Reviews: 2
5 | 0 % | |
4 | 100 % | |
3 | 0 % | |
2 | 0 % | |
1 | 0 % |
Discussion
FAQ
BTCUSD
Forex
Signal
Breakout
Indices
EURUSD
Commodities
GBPUSD
NZDUSD
Fibonacci
Prop
Scalping
Fair Value Gap
SMC
Crypto
Stocks
XAUUSD
NAS100
USDJPY
VWAP
Products available through cTrader Store, including trading bots, indicators and plugins, are provided by third-party developers and made available for informational and technical access purposes only. cTrader Store is not a broker and does not provide investment advice, personal recommendations or any guarantee of future performance.
More from this author


Price
Since 26/09/2025
13
Sales