
Description
Swing High / Low & Break of Structure Indicator
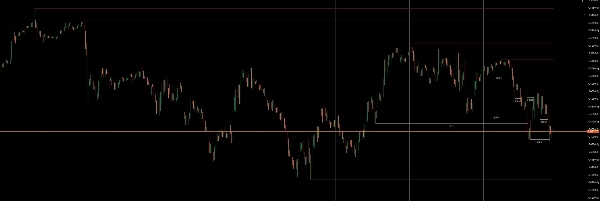
Clean Market Structure automatically detects Swing Highs and Swing Lows and plots dynamic Support and Resistance levels based on confirmed pivot structure.
Levels extend forward in time until price breaks them. When a Break of Structure (BOS) occurs, the level is converted into a historical line with a break label, allowing traders to quickly identify structural shifts and liquidity sweeps.
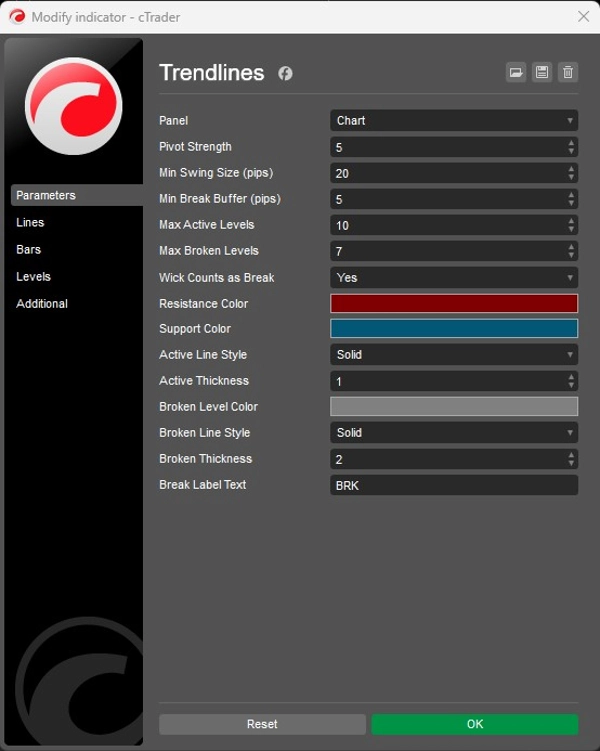
The indicator includes filters such as minimum swing size and break buffers to ignore insignificant pivots and focus only on meaningful market structure.
Active and broken levels use separate visual styles, while built-in limits keep the chart clean by controlling how many levels remain visible.
Because pivots are confirmed only after the required number of candles close, the structure logic is stable and non-repainting.
Key Features
• Automatic Swing High / Swing Low detection
• Dynamic Support & Resistance levels
• Automatic Break of Structure (BOS) marking
• Minimum swing filter to remove noise
• Optional wick or close break detection
• Separate styling for active vs broken levels
• Limits for active and historical levels to keep charts clean
• Non-repainting pivot logic
Ideal For
• Price Action trading
• Support & Resistance strategies
• Liquidity-based trading
• Break of Structure systems
• Scalping, intraday, and swing trading
Summary
Customer reviews
5 | 67 % | |
4 | 33 % | |
3 | 0 % | |
2 | 0 % | |
1 | 0 % |


