
Professional-grade Anchored VWAP
Indicator
3 purchases
Version 1.0, Nov 2025
Windows, Mac
4.5
Reviews: 2
Description
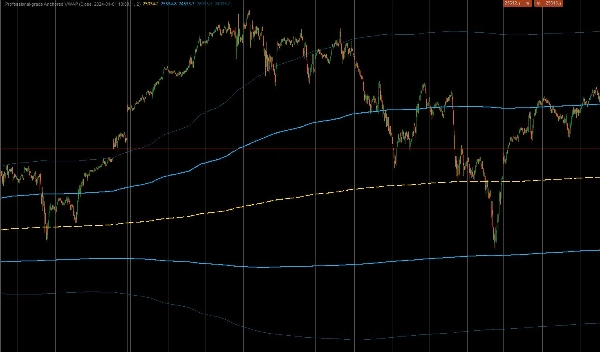
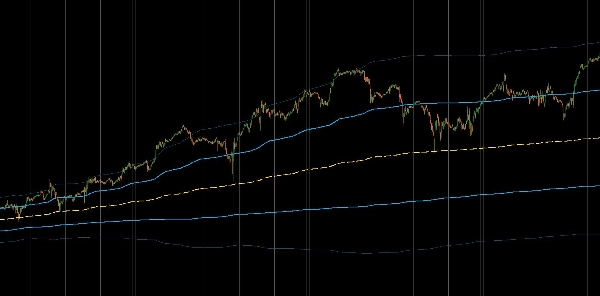
This is a professional-grade custom indicator for cTrader designed to calculate the Anchored Volume Weighted Average Price (AVWAP). Unlike standard VWAP indicators that reset daily, this tool allows traders to "anchor" the calculation to a specific high-impact event—such as a CPI release, a market crash, or the start of a trend—providing a true institutional view of the average price since that moment. It also includes Volume-Weighted Standard Deviation Bands to identify overextended price action.
1. Core Calculation & Anchoring Logic
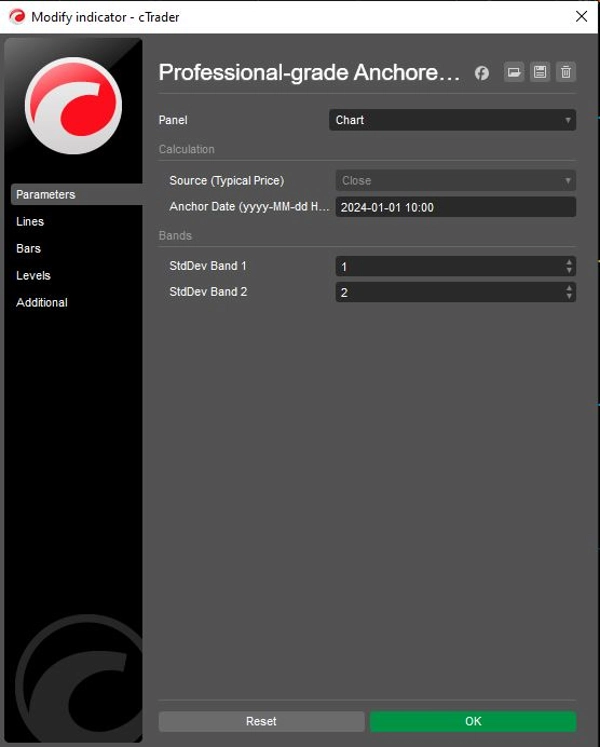
- Precision Anchoring: The indicator utilizes a user-defined
Anchor Date(e.g., "2024-01-01 10:00") to strictly ignore all data prior to that specific minute. This ensures the average price reflects only the participants involved in the current specific move or timeframe. - Institutional Formula: It calculates the true VWAP using the cumulative sum of (Price × Volume) divided by the cumulative sum of Volume.
- Typical Price Source: By default, it uses the "Typical Price"
(High + Low + Close) / 3for calculations, which is the standard method used by institutional algorithms to determine fair value, though this can be adjusted to Open or Close prices.
2. Advanced Volatility Bands
To help traders gauge market extremes, the indicator calculates two sets of dynamic bands based on Volume-Weighted Variance:
- Band 1 (The Value Zone): Defaults to 1.0 Standard Deviation. This inner zone typically contains the "fair value" noise of the market. A breakout from this zone often signals momentum.
- Band 2 (The Extreme Zone): Defaults to 2.0 Standard Deviations. Prices reaching this outer band are statistically overextended, often signaling potential mean-reversion opportunities (fading the move) or strong trend exhaustion.
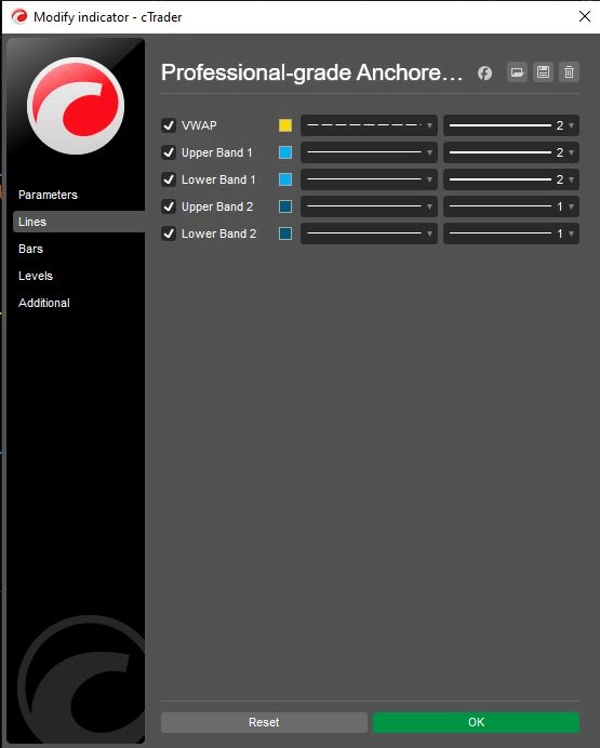
- Independent Control: Both bands include individual
Showtoggles (ShowBand1,ShowBand2) and customizable deviation multipliers (Band1Dev,Band2Dev), allowing for clean charts tailored to specific volatility strategies.
3. Visual & Operational Logic
- Strategic Color Coding:
- Yellow (VWAP): Acts as the central "magnet" or trend baseline.
- Lime Green (Band 1): Represents the immediate support/resistance "Value Area".
- Red (Band 2): Highlights extreme deviations where reversal probability increases.
- State Preservation: The code utilizes
IndicatorDataSeriesfor internal state variables (_cumVol,_cumPV), ensuring that values remain accurate during historical recalculations and real-time updates without repainting errors.
Logic Flow Summary
- Initialize: Parse the user's specific Anchor Date string into a system DateTime object.
- Filter Time: For every bar, check if the current time is before the Anchor. If so, return
NaN(draw nothing) and reset cumulative counters to zero. - Accumulate Data: Once the Anchor time is reached, begin adding the current bar's Volume and (Price × Volume) to the running total.
- Compute VWAP: Divide the Running PV Total by the Running Volume Total to get the VWAP line.
- Compute Variance: Calculate volume-weighted variance and derive the Standard Deviation.
- Plot Bands: Add/Subtract the calculated Deviation from the VWAP to plot the Lime and Red bands.
Summary
AI summary
This professional-grade custom indicator for cTrader calculates the Anchored Volume Weighted Average Price (AVWAP) and volume-weighted standard deviation bands from a user-defined start date. Unlike standard VWAP indicators that reset daily, it anchors the VWAP calculation to a specific event or time, such as a market release or trend start, providing an institutional perspective on average price since that anchor point.
Key features include:
- Precision anchoring to a user-specified date and time, ignoring data before that moment.
- Institutional VWAP calculation using cumulative (Price × Volume) divided by cumulative Volume.
- Default use of Typical Price ((High + Low + Close) / 3) for fair value, adjustable to Open or Close prices.
- Two dynamic volatility bands based on volume-weighted variance: Band 1 (1 standard deviation) representing the value zone, and Band 2 (2 standard deviations) indicating extreme price deviations.
- Independent toggles and customizable deviation multipliers for each band.
- Strategic color coding: yellow for VWAP, lime green for Band 1, and red for Band 2.
- Internal state preservation ensures accurate values during historical and real-time updates without repainting.
The indicator supports markets including Forex, indices, commodities, stocks, and cryptocurrencies, and is suitable for various symbols such as BTCUSD, EURUSD, GBPUSD, XAUUSD, and NAS100.
Indicator profile
Customer reviews
4.5
Reviews: 2
5 | 50 % | |
4 | 50 % | |
3 | 0 % | |
2 | 0 % | |
1 | 0 % |
Discussion
FAQ
BTCUSD
Forex
Breakout
Indices
EURUSD
Commodities
GBPUSD
NZDUSD
Bollinger
Fibonacci
Scalping
SMC
Crypto
Stocks
XAUUSD
NAS100
USDJPY
VWAP
Products available through cTrader Store, including trading bots, indicators and plugins, are provided by third-party developers and made available for informational and technical access purposes only. cTrader Store is not a broker and does not provide investment advice, personal recommendations or any guarantee of future performance.


Price
Since 26/09/2025
16
Sales