
Description
Previous Day High / Low – Virgin Levels Ultimate
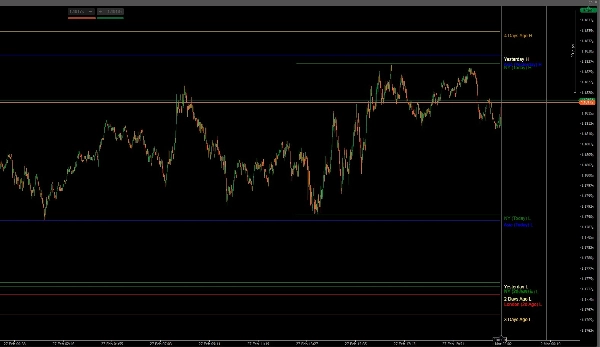
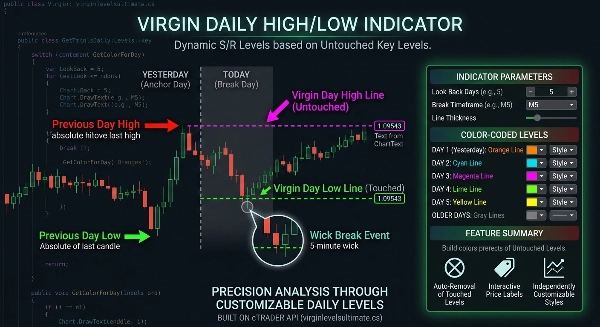
Virgin Levels Ultimate is a precision level-tracking indicator that automatically plots untapped highs and lows from prior trading days and keeps them on your chart until price breaks them.
Built for traders who understand that untouched liquidity levels act as magnets for price, this tool gives you a clean, structured framework for breakout and reversal execution.
Now extended with Asia, London, and New York session highs/lows, plus Previous Weekly and Monthly levels, creating a complete multi-timeframe liquidity map.
Designed for Forex, indices, gold, and crypto — across all timeframes.
Trade key liquidity. Trade with precision.
⚙ Core Engine
- Automatic detection of previous daily highs and lows
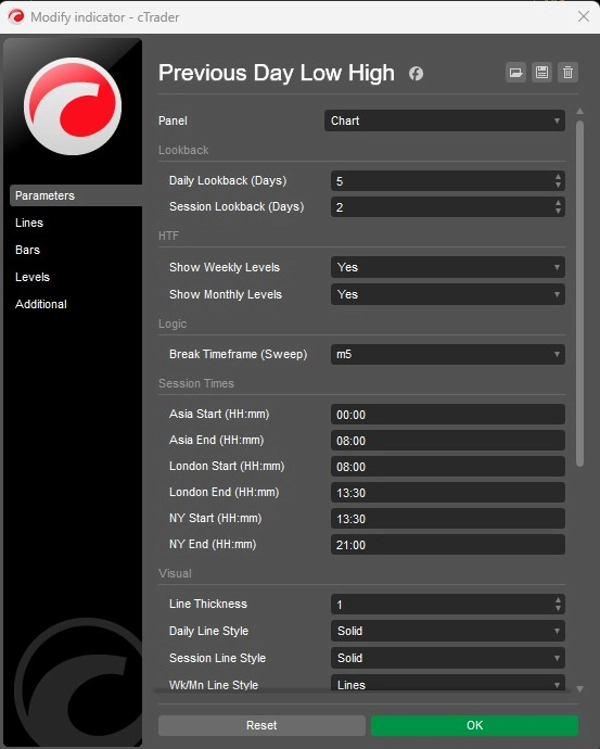
- Customizable daily lookback period (track multiple past days)
- Asia, London, and New York session high/low detection
- Session lookback control (track multiple previous sessions)
- Previous Weekly High / Low (optional)
- Previous Monthly High / Low (optional)
- Levels activate only from the next valid trading period
- Automatic removal once level is touched (no clutter)
- Break detection based on selectable lower timeframe
- Real-time level validation
📊 Virgin Level Logic
- Plots only untouched (virgin) highs and lows
- Daily, Session, Weekly, and Monthly levels separated clearly
- Multi-day tracking (Day 1 to Day 5+)
- Session tracking (Today, Yesterday, custom lookback)
- Older days visually distinguished
- Dynamic support & resistance mapping
- Liquidity-based breakout framework
- Multi-timeframe confluence structure
🕒 Smart Break Detection
- Selectable break timeframe (e.g., M5, M15, etc.)
- Intraday precision for level invalidation
- High/Low scan from valid activation time
- Works across Daily, Session, Weekly, and Monthly levels
- Stops plotting immediately after confirmed touch
- Clean chart logic — no historical overdraw
🎨 Full Customization
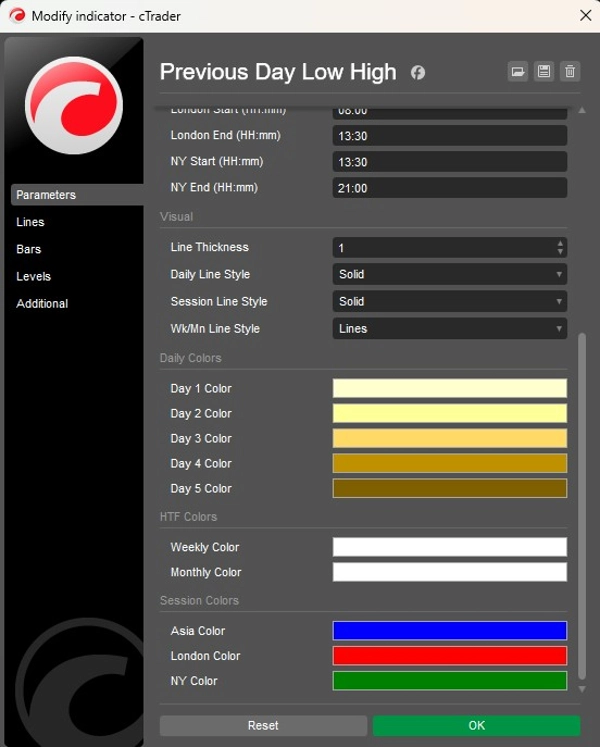
- Independent color control for each daily lookback
- Dedicated colors for Asia, London, and New York sessions
- Separate colors for Weekly and Monthly levels
- Adjustable line styles (Daily / Session / HTF)
- Custom thickness settings
- Auto price labels with smart stacking (no overlap)
- Minimal, professional chart appearance
🎯 Ideal For
- Liquidity sweep traders
- Breakout & fakeout traders
- SMC / ICT-style traders
- Session-based traders (Asia, London, NY)
- Intraday and swing traders
- Prop firm rule-based systems
- Multi-asset traders (Forex, indices, metals, crypto)
Summary
Key features include automatic detection and plotting of prior highs and lows, customizable lookback periods for days and sessions, real-time validation, and automatic removal of levels once touched to reduce chart clutter. It visually distinguishes older levels and separates daily, session, weekly, and monthly levels with independent color and style customization. The tool supports dynamic support and resistance mapping and provides a liquidity-based breakout framework suitable for Forex, indices, gold, cryptocurrencies, and other markets.
This indicator is suitable for liquidity sweep traders, breakout and fakeout strategies, smart money concept (SMC) and institutional trading (ICT) styles, session-based trading, intraday and swing trading, prop firm rule-based systems, and multi-asset trading. It offers a professional, minimal chart appearance with auto price labels and smart stacking.
Customer reviews
5 | 100 % | |
4 | 0 % | |
3 | 0 % | |
2 | 0 % | |
1 | 0 % |


