
Volume Meter
Indicatore
2 acquisti
Versione 1.0, Sep 2025
Windows, Mac
5.0
Recensioni: 1
Da 29/05/2025
3.04M
Volume negoziato
45.22K
Profitto in pip
29
Vendite
769
Installazioni gratuite
Descrizione
📘 Cosa Fa Questo Indicatore
- Mostra il volume tick (numero di variazioni di prezzo per barra) come un istogramma.
- Nel Forex, i broker raramente forniscono il volume reale scambiato, quindi il volume tick viene usato come proxy.
- In azioni/CFD/futures, potresti ottenere il volume reale.
- Sovrappone una Media Mobile del volume (default 20 periodi).
- Questa funge da “linea di base” per individuare rapidamente se il volume della barra corrente è insolitamente alto o basso.
🎯 Come Usarlo come Conferma
L'indicatore non è un generatore di segnali autonomo. Invece, i trader lo usano per confermare setup da altre strategie:
- Conferma di Breakout
-
- Se il prezzo rompe sopra la resistenza o sotto il supporto, verifica se la candela di breakout ha volume superiore alla sua MA.
- Un volume alto conferma che più partecipanti sono dietro al movimento → il breakout è più affidabile.
- Breakout a basso volume = maggiore probabilità di falso breakout.
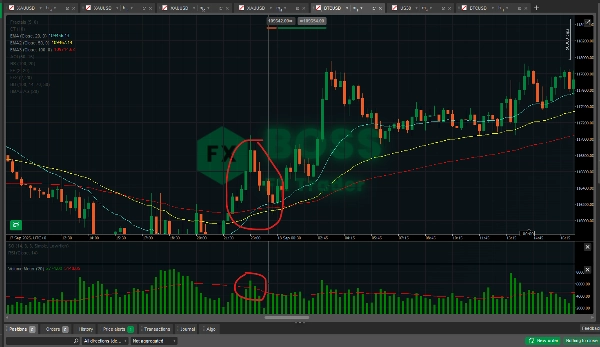
- Continuazione vs. Esaurimento del Trend
-
- In un trend forte, le candele di pullback spesso hanno volume inferiore rispetto alle candele di impulso.
- Se un pullback avviene con basso volume e la mossa successiva riprende con volume più alto → conferma la continuazione del trend.
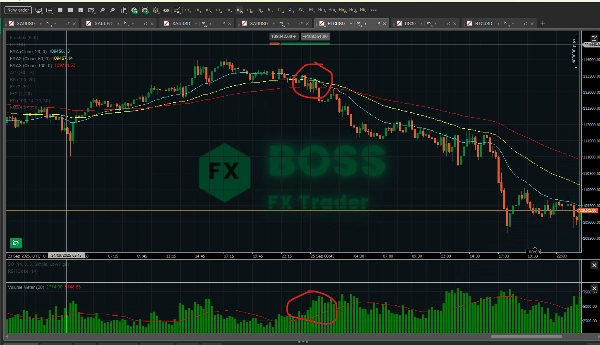
- Se vedi la spinta del trend continuare ma il volume diminuire a ogni spinta → possibile esaurimento, preparati a un'inversione.
- Conferma di Inversione
-
- Grandi candele di inversione (pin bar, candele engulfing, frattali) sono più forti se supportate da uno scoppio di volume.
- Esempio: pin bar rialzista al supporto con alto volume = segnale di inversione più forte rispetto allo stesso pin bar con basso volume.
- Filtro per Segnali Falsi
-
- Se il tuo sistema principale dà un segnale di acquisto/vendita, ma il volume è debole (sotto la media), potresti scegliere di non entrare in quel trade.
- Aiuta a ridurre l'overtrading e a filtrare il rumore.
📊 Efficacia
- Nel Forex: Il volume tick ha mostrato una forte correlazione con il volume reale scambiato (70–90% di correlazione in molti studi). Quindi è utile, ma non perfetto.
- In Azioni/Futures/CFD: Il volume reale rende questo molto più potente poiché misuri contratti/azioni effettivamente scambiati.
- Come Conferma: È meglio usarlo insieme all'azione del prezzo e ad altri indicatori (es. EMA, RSI, frattali). Affidarsi solo al volume è rischioso.
- Punti di Forza: Conferma i breakout, filtra i movimenti falsi, individua l'esaurimento.
- Punti di Debolezza: Non predice la direzione da solo — aggiunge solo fiducia una volta che hai un setup.
✅ Consiglio Pratico:
Usa l'indicatore come filtro, non come innesco. Per esempio:
- Vedi un crossover EMA (segnale di acquisto).
- Controlla: il volume è sopra la sua media mobile? Se sì → entra nel trade. Se no → aspetta.
In questo modo fai trading solo quando il momentum è supportato dalla partecipazione del mercato.
Riepilogo
Riepilogo AI
Volume Meter is a trading indicator that displays tick volume—the number of price changes per bar—as a histogram. In Forex markets, where real traded volume data is often unavailable, tick volume serves as a proxy, while in stocks, CFDs, and futures, real volume data may be used. The indicator overlays a moving average of volume (default 20-period) to provide a baseline, helping traders identify whether current volume is unusually high or low.
This tool is designed to confirm trading setups rather than generate standalone signals. It assists in validating breakouts by checking if breakout candles have volume above their moving average, indicating stronger market participation. It also helps distinguish trend continuation from exhaustion by comparing volume levels during pullbacks and impulse moves. Additionally, it supports reversal confirmation by highlighting volume spikes on significant reversal candles and filters false signals by advising caution when volume is weak despite buy or sell signals from other systems.
Volume Meter is applicable across various markets including Forex, stocks, indices, commodities, and cryptocurrencies. Its effectiveness is enhanced when combined with price action and other indicators such as EMA or RSI. The indicator aids in improving trade decision confidence by integrating volume analysis as a confirmation and filtering tool.
Profilo indicatore
Recensioni dei clienti
5.0
Recensioni: 1
5 | 100 % | |
4 | 0 % | |
3 | 0 % | |
2 | 0 % | |
1 | 0 % |
Recensioni dei clienti
October 1, 2025
the first 10 trades should stay boring, and the checklist becomes easier to follow.
Discussioni
Domande frequenti
BTCUSD
Forex
Breakout
Indices
EURUSD
Commodities
GBPUSD
NZDUSD
Prop
Supertrend
Crypto
Stocks
XAUUSD
NAS100
USDJPY
I prodotti disponibili tramite cTrader Store, inclusi bot di trading, indicatori e plugin, sono forniti da sviluppatori terzi e resi disponibili esclusivamente a scopo informativo e di accesso tecnico. cTrader Store non è un broker e non fornisce consulenze in materia di investimento, raccomandazioni individualizzate o garanzie di risultati futuri.


![Logo di "[Stellar Strategies] MARSI Signal Plotter"](https://cdn.ctrader.com/image/webp/7b2b8da6-8f8e-4646-8d4a-4710c516c01e_25567)


Prezzo
Da 29/05/2025
3.04M
Volume negoziato
45.22K
Profitto in pip
29
Vendite
769
Installazioni gratuite