
Açıklama
cTrader için gelişmiş bir versiyon olan Stochastic RSI PRO'yu tanıtıyoruz, ticaret hassasiyetinizi artırmak için tasarlanmış Stochastic RSI göstergesinin.
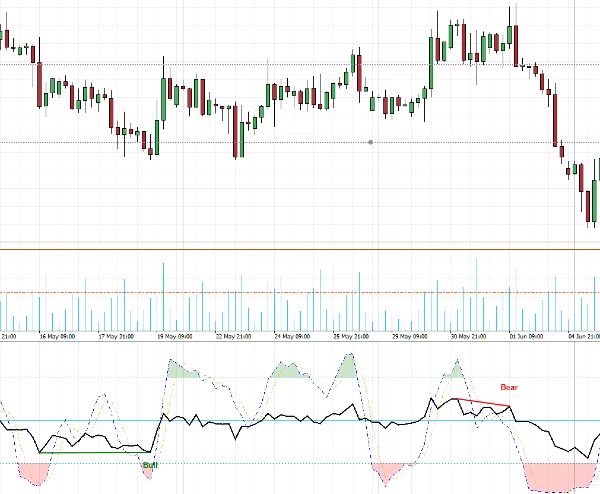
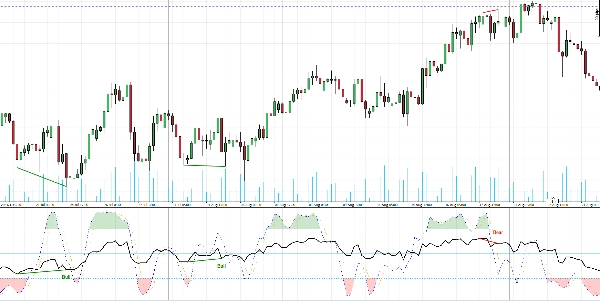
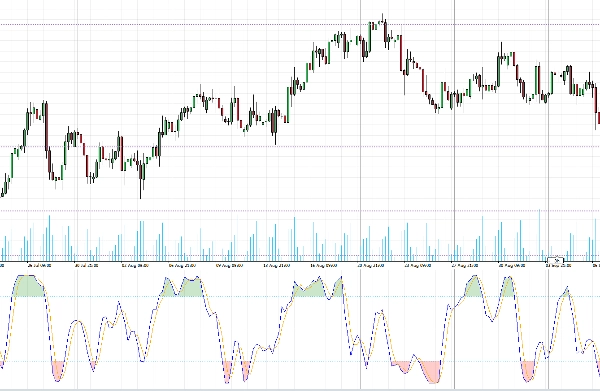
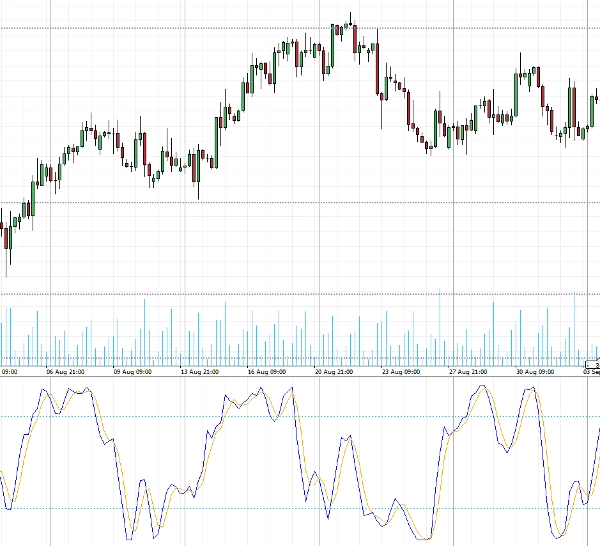
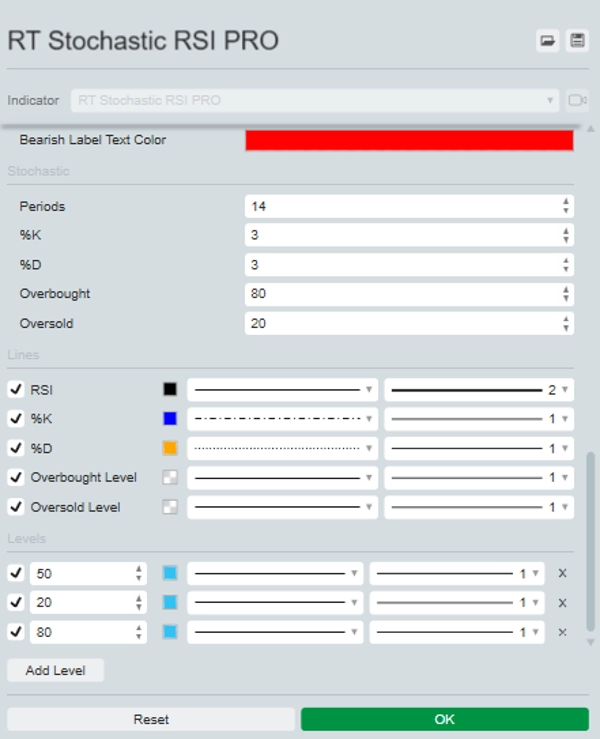
Bu güçlü araç, RSI'yı doğrudan Stochastic RSI üzerine bindirerek piyasa momentumu hakkında kapsamlı bir görünüm sunar. Aşırı alım ve aşırı satım bölgelerini kolayca tanımlanabilmesi için belirgin renklerle vurgular.
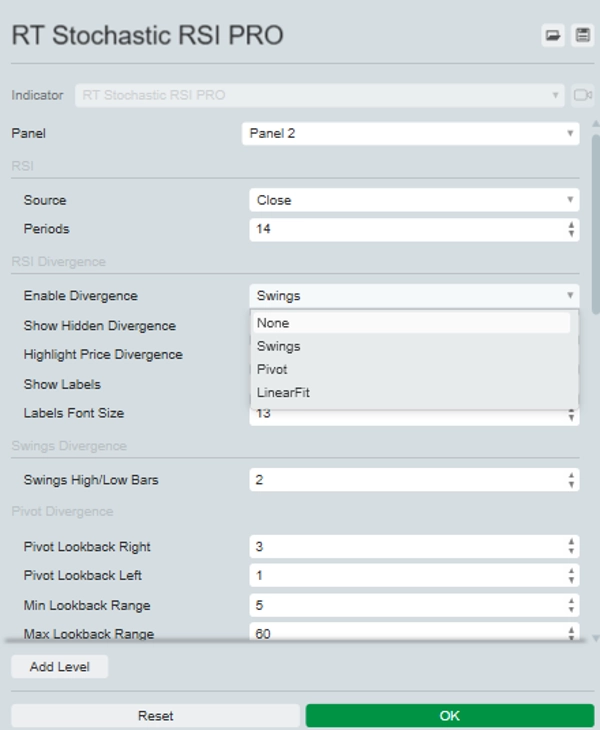
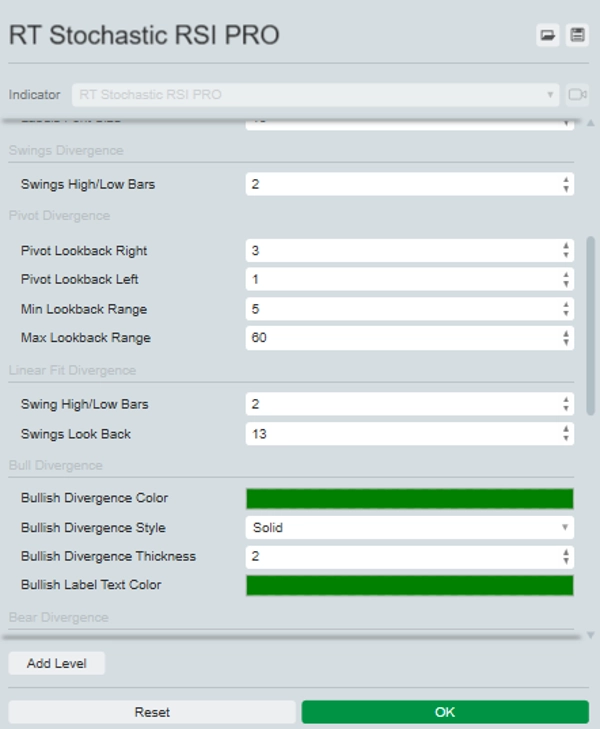
Stochastic RSI PRO'nun öne çıkan özelliği, grafikte hem normal hem de gizli uyumsuzlukları tanımlama ve isteğe bağlı olarak vurgulama yeteneğidir. Uyumsuzlukları tanımlamak için üç yöntem arasından seçim yapabilirsiniz: Swing, Pivot veya Linear Fit; her biri ticaret stratejinize uyacak şekilde özelleştirilebilir ayarlara sahiptir.
Analizinizi ve karar verme sürecinizi Stochastic RSI PRO ile yükseltin, seçkin tüccarlar için vazgeçilmez bir araç.


